mirror of
https://github.com/dfinke/ImportExcel.git
synced 2025-12-20 18:23:18 +00:00
Compare commits
28 Commits
| Author | SHA1 | Date | |
|---|---|---|---|
|
|
b99b7ba799 | ||
|
|
17b5d2caec | ||
|
|
6add16aa9f | ||
|
|
9aa0192ee6 | ||
|
|
fa25d1ac06 | ||
|
|
8131eee50f | ||
|
|
3ce485a144 | ||
|
|
bb1b413ada | ||
|
|
08078410dc | ||
|
|
3edcc0bdfb | ||
|
|
25081f84c1 | ||
|
|
668e3c982c | ||
|
|
98cf7e03c1 | ||
|
|
5b5c1c6fce | ||
|
|
4383916090 | ||
|
|
7c2bbf9595 | ||
|
|
48ca35b9ff | ||
|
|
68be3c3483 | ||
|
|
78326b4258 | ||
|
|
94b10b6f51 | ||
|
|
8ac9815e83 | ||
|
|
b3184d36a9 | ||
|
|
e58265075a | ||
|
|
453b2d8963 | ||
|
|
bc816851c9 | ||
|
|
b0a68e3445 | ||
|
|
8a1d0b0cf8 | ||
|
|
26f55251e2 |
@@ -1,4 +1,9 @@
|
||||
Function Add-ConditionalFormatting {
|
||||
try {
|
||||
#ensure that color and font lookups are available
|
||||
[void] [System.Reflection.Assembly]::LoadWithPartialName("System.Drawing")
|
||||
}
|
||||
catch {}
|
||||
Function Add-ConditionalFormatting {
|
||||
<#
|
||||
.Synopsis
|
||||
Adds conditional formatting to all or part of a worksheet.
|
||||
@@ -105,7 +110,7 @@
|
||||
[OfficeOpenXml.ConditionalFormatting.eExcelConditionalFormattingRuleType]$RuleType ,
|
||||
#Text color for matching objects
|
||||
[Parameter(ParameterSetName = "NamedRule")]
|
||||
[Alias("ForegroundColour")]
|
||||
[Alias("ForegroundColour","FontColor")]
|
||||
$ForegroundColor,
|
||||
#Color for databar type charts
|
||||
[Parameter(Mandatory = $true, ParameterSetName = "DataBar")]
|
||||
|
||||
@@ -27,6 +27,10 @@ if (Get-Command -Name register-argumentCompleter -ErrorAction SilentlyContinue)
|
||||
Register-ArgumentCompleter -CommandName New-ConditionalText -ParameterName PatternColor -ScriptBlock $Function:ColorCompletion
|
||||
Register-ArgumentCompleter -CommandName New-ConditionalText -ParameterName BackgroundColor -ScriptBlock $Function:ColorCompletion
|
||||
Register-ArgumentCompleter -CommandName New-ConditionalText -ParameterName ConditionalTextColor -ScriptBlock $Function:ColorCompletion
|
||||
Register-ArgumentCompleter -CommandName New-ExcelStyle -ParameterName BackgroundColor -ScriptBlock $Function:ColorCompletion
|
||||
Register-ArgumentCompleter -CommandName New-ExcelStyle -ParameterName FontColor -ScriptBlock $Function:ColorCompletion
|
||||
Register-ArgumentCompleter -CommandName New-ExcelStyle -ParameterName BorderColor -ScriptBlock $Function:ColorCompletion
|
||||
Register-ArgumentCompleter -CommandName New-ExcelStyle -ParameterName PatternColor -ScriptBlock $Function:ColorCompletion
|
||||
Register-ArgumentCompleter -CommandName Set-ExcelRange -ParameterName BackgroundColor -ScriptBlock $Function:ColorCompletion
|
||||
Register-ArgumentCompleter -CommandName Set-ExcelRange -ParameterName FontColor -ScriptBlock $Function:ColorCompletion
|
||||
Register-ArgumentCompleter -CommandName Set-ExcelRange -ParameterName BorderColor -ScriptBlock $Function:ColorCompletion
|
||||
@@ -37,5 +41,4 @@ if (Get-Command -Name register-argumentCompleter -ErrorAction SilentlyContinue)
|
||||
Register-ArgumentCompleter -CommandName Set-ExcelRow -ParameterName BackgroundColor -ScriptBlock $Function:ColorCompletion
|
||||
Register-ArgumentCompleter -CommandName Set-ExcelRow -ParameterName FontColor -ScriptBlock $Function:ColorCompletion
|
||||
Register-ArgumentCompleter -CommandName Set-ExcelRow -ParameterName PatternColor -ScriptBlock $Function:ColorCompletion
|
||||
|
||||
}
|
||||
21
Examples/Charts/ChartAndTrendlines.ps1
Normal file
21
Examples/Charts/ChartAndTrendlines.ps1
Normal file
@@ -0,0 +1,21 @@
|
||||
# Creates a worksheet, addes a chart and then a Linear trendline
|
||||
|
||||
$xlfile = "$env:TEMP\trendLine.xlsx"
|
||||
Remove-Item $xlfile -ErrorAction SilentlyContinue
|
||||
|
||||
$data = ConvertFrom-Csv @"
|
||||
Region,Item,TotalSold
|
||||
West,screws,60
|
||||
South,lemon,48
|
||||
South,apple,71
|
||||
East,screwdriver,70
|
||||
East,kiwi,32
|
||||
West,screwdriver,1
|
||||
South,melon,21
|
||||
East,apple,79
|
||||
South,apple,68
|
||||
South,avocado,73
|
||||
"@
|
||||
|
||||
$cd = New-ExcelChartDefinition -XRange Region -YRange TotalSold -ChartType ColumnClustered -ChartTrendLine Linear
|
||||
$data | Export-Excel $xlfile -ExcelChartDefinition $cd -AutoNameRange -Show
|
||||
27
Examples/Charts/NumberOfVisitors.ps1
Normal file
27
Examples/Charts/NumberOfVisitors.ps1
Normal file
@@ -0,0 +1,27 @@
|
||||
$xlfile = "$env:TEMP\visitors.xlsx"
|
||||
Remove-Item $xlfile -ErrorAction SilentlyContinue
|
||||
|
||||
$data = ConvertFrom-Csv @"
|
||||
Week, TotalVisitors
|
||||
1,11916
|
||||
2,11665
|
||||
3,13901
|
||||
4,15444
|
||||
5,21592
|
||||
6,15057
|
||||
7,26187
|
||||
8,20662
|
||||
9,28935
|
||||
10,32443
|
||||
"@
|
||||
|
||||
$cd = New-ExcelChartDefinition `
|
||||
-XRange Week `
|
||||
-YRange TotalVisitors `
|
||||
-Title "No. Of Visitors" `
|
||||
-ChartType ColumnClustered `
|
||||
-NoLegend `
|
||||
-ChartTrendLine Linear
|
||||
|
||||
$data | Export-Excel $xlfile -Show -AutoNameRange -AutoSize -TableName Visitors -ExcelChartDefinition $cd
|
||||
|
||||
@@ -1,6 +1,6 @@
|
||||
try {. $PSScriptRoot\..\..\LoadPSD1.ps1} catch {}
|
||||
|
||||
$f = ".\dashboard.xlsx"
|
||||
$f = "$env:temp\dashboard.xlsx"
|
||||
Remove-Item $f -ErrorAction Ignore
|
||||
|
||||
$data = @"
|
||||
@@ -69,4 +69,4 @@ Set-Format -Address $sheet1.Cells["I10"] -Formula "=Sum(I3:I8)" -Bold
|
||||
Set-Format -Address $sheet1.Cells["M10"] -Formula "=Sum(M3:M8)" -Bold
|
||||
Set-Format -Address $sheet1.Cells["O10"] -Formula "=Sum(O3:O8)" -Bold
|
||||
|
||||
Close-ExcelPackage $excel -Show
|
||||
Close-ExcelPackage $excel -Show
|
||||
|
||||
35
Examples/Styles/MultipleStyles.ps1
Normal file
35
Examples/Styles/MultipleStyles.ps1
Normal file
@@ -0,0 +1,35 @@
|
||||
try { . $PSScriptRoot\..\..\LoadPSD1.ps1 } catch { }
|
||||
|
||||
$xlfile = "$env:TEMP\test.xlsx"
|
||||
Remove-Item $xlfile -ErrorAction SilentlyContinue
|
||||
|
||||
$data = ConvertFrom-Csv @"
|
||||
Region,Item,TotalSold
|
||||
North,melon,38
|
||||
South,screwdriver,21
|
||||
South,peach,33
|
||||
South,saw,81
|
||||
South,kiwi,70
|
||||
North,orange,59
|
||||
North,avocado,25
|
||||
South,lime,48
|
||||
South,nail,83
|
||||
North,apple,2
|
||||
"@
|
||||
|
||||
$styleParams = @{
|
||||
FontSize = 13
|
||||
Bold = $true
|
||||
}
|
||||
|
||||
$styles = $(
|
||||
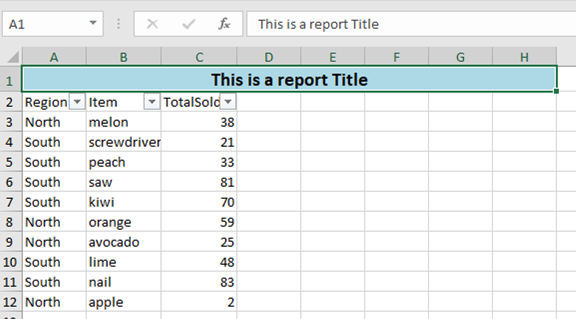
New-ExcelStyle -BackgroundColor LightBlue -FontSize 14 -Bold -Range "A1:H1" -HorizontalAlignment Center -Merge
|
||||
|
||||
New-ExcelStyle -BackgroundColor LimeGreen -Range "B10" @styleParams
|
||||
New-ExcelStyle -BackgroundColor PeachPuff -Range "B5" @styleParams
|
||||
New-ExcelStyle -BackgroundColor Orange -Range "B8" @styleParams
|
||||
New-ExcelStyle -BackgroundColor Red -Range "B12" @styleParams
|
||||
)
|
||||
|
||||
$reportTitle = "This is a report Title"
|
||||
$data | Export-Excel $xlfile -Show -AutoSize -AutoFilter -Title $reportTitle -Style $styles
|
||||
23
Examples/Styles/NewExcelStyle.ps1
Normal file
23
Examples/Styles/NewExcelStyle.ps1
Normal file
@@ -0,0 +1,23 @@
|
||||
# https://raw.githubusercontent.com/dfinke/ImportExcel/master/images/NewExcelStyle.png
|
||||
try { . $PSScriptRoot\..\..\LoadPSD1.ps1 } catch { }
|
||||
|
||||
$xlfile = "$env:TEMP\test.xlsx"
|
||||
Remove-Item $xlfile -ErrorAction SilentlyContinue
|
||||
|
||||
$data = ConvertFrom-Csv @"
|
||||
Region,Item,TotalSold
|
||||
North,melon,38
|
||||
South,screwdriver,21
|
||||
South,peach,33
|
||||
South,saw,81
|
||||
South,kiwi,70
|
||||
North,orange,59
|
||||
North,avocado,25
|
||||
South,lime,48
|
||||
South,nail,83
|
||||
North,apple,2
|
||||
"@
|
||||
|
||||
$reportTitle = "This is a report Title"
|
||||
$style = New-ExcelStyle -BackgroundColor LightBlue -FontSize 14 -Bold -Range "A1:H1" -HorizontalAlignment Center -Merge
|
||||
$data | Export-Excel $xlfile -Show -AutoSize -AutoFilter -Title $reportTitle -Style $style
|
||||
38
Examples/VBA/HelloWorldVBA.ps1
Normal file
38
Examples/VBA/HelloWorldVBA.ps1
Normal file
@@ -0,0 +1,38 @@
|
||||
$xlfile = "$env:temp\test.xlsm"
|
||||
Remove-Item $xlfile -ErrorAction SilentlyContinue
|
||||
|
||||
$Excel = ConvertFrom-Csv @"
|
||||
Region,Item,TotalSold
|
||||
West,screwdriver,98
|
||||
West,kiwi,19
|
||||
North,kiwi,47
|
||||
West,screws,48
|
||||
West,avocado,52
|
||||
East,avocado,40
|
||||
South,drill,61
|
||||
North,orange,92
|
||||
South,drill,29
|
||||
South,saw,36
|
||||
"@ | Export-Excel $xlfile -PassThru -AutoSize
|
||||
|
||||
$wb = $Excel.Workbook
|
||||
$sheet = $wb.Worksheets["Sheet1"]
|
||||
$wb.CreateVBAProject()
|
||||
|
||||
$code = @"
|
||||
Public Function HelloWorld() As String
|
||||
HelloWorld = "Hello World"
|
||||
End Function
|
||||
|
||||
Public Function DoSum() As Integer
|
||||
DoSum = Application.Sum(Range("C:C"))
|
||||
End Function
|
||||
"@
|
||||
|
||||
$module = $wb.VbaProject.Modules.AddModule("PSExcelModule")
|
||||
$module.Code = $code
|
||||
|
||||
Set-Format -WorkSheet $sheet -Range "h7" -Formula "HelloWorld()" -AutoSize
|
||||
Set-Format -WorkSheet $sheet -Range "h8" -Formula "DoSum()" -AutoSize
|
||||
|
||||
Close-ExcelPackage $Excel -Show
|
||||
@@ -499,6 +499,7 @@
|
||||
[Switch]$AutoNameRange,
|
||||
[Int]$StartRow = 1,
|
||||
[Int]$StartColumn = 1,
|
||||
[alias('PT')]
|
||||
[Switch]$PassThru,
|
||||
[String]$Numberformat = 'General',
|
||||
[string[]]$ExcludeProperty,
|
||||
@@ -507,6 +508,7 @@
|
||||
[String[]]$NoNumberConversion,
|
||||
[Object[]]$ConditionalFormat,
|
||||
[Object[]]$ConditionalText,
|
||||
[Object[]]$Style,
|
||||
[ScriptBlock]$CellStyleSB,
|
||||
#If there is already content in the workbook the sheet with the PivotTable will not be active UNLESS Activate is specified
|
||||
[switch]$Activate,
|
||||
@@ -1022,7 +1024,10 @@
|
||||
}
|
||||
catch {throw "Error applying conditional formatting to worksheet $_"}
|
||||
}
|
||||
|
||||
foreach ($s in $Style) {
|
||||
if (-not $s.Range) {$s["Range"] = $ws.Dimension.Address }
|
||||
Set-ExcelRange -WorkSheet $ws @s
|
||||
}
|
||||
if ($CellStyleSB) {
|
||||
try {
|
||||
$TotalRows = $ws.Dimension.Rows
|
||||
|
||||
@@ -4,7 +4,7 @@
|
||||
RootModule = 'ImportExcel.psm1'
|
||||
|
||||
# Version number of this module.
|
||||
ModuleVersion = '6.1.0'
|
||||
ModuleVersion = '6.2.1'
|
||||
|
||||
# ID used to uniquely identify this module
|
||||
GUID = '60dd4136-feff-401a-ba27-a84458c57ede'
|
||||
@@ -103,6 +103,7 @@ Check out the How To Videos https://www.youtube.com/watch?v=U3Ne_yX4tYo&list=PL5
|
||||
'New-ConditionalFormattingIconSet',
|
||||
'New-ConditionalText',
|
||||
'New-ExcelChartDefinition',
|
||||
'New-ExcelStyle',
|
||||
'New-PivotTableDefinition',
|
||||
'New-Plot',
|
||||
'New-PSItem',
|
||||
|
||||
@@ -345,8 +345,11 @@ function Import-Excel {
|
||||
}
|
||||
|
||||
process {
|
||||
if ($Path -and $Password) {$ExcelPackage = Open-ExcelPackage -Path $Path -Password $Password}
|
||||
elseif ($Path) {$ExcelPackage = Open-ExcelPackage -Path $Path}
|
||||
if ($path) {
|
||||
$stream = New-Object -TypeName System.IO.FileStream -ArgumentList $Path, 'Open', 'Read', 'ReadWrite'
|
||||
if ($Password) {$ExcelPackage = New-Object -TypeName OfficeOpenXml.ExcelPackage -ArgumentList $stream , $Password }
|
||||
else {$ExcelPackage = New-Object -TypeName OfficeOpenXml.ExcelPackage -ArgumentList $stream}
|
||||
}
|
||||
try {
|
||||
#Select worksheet
|
||||
if (-not $WorksheetName) { $Worksheet = $ExcelPackage.Workbook.Worksheets[1] }
|
||||
@@ -414,7 +417,7 @@ function Import-Excel {
|
||||
}
|
||||
catch { throw "Failed importing the Excel workbook '$Path' with worksheet '$Worksheetname': $_"; return }
|
||||
finally {
|
||||
if ($Path) {Close-ExcelPackage -ExcelPackage $ExcelPackage -NoSave }
|
||||
if ($Path) {$stream.close(); $ExcelPackage.Dispose() }
|
||||
}
|
||||
}
|
||||
}
|
||||
@@ -513,7 +516,7 @@ Function WorksheetArgumentCompleter {
|
||||
param($commandName, $parameterName, $wordToComplete, $commandAst, $fakeBoundParameter)
|
||||
$xlPath = $fakeBoundParameter['Path']
|
||||
if (Test-Path -Path $xlPath) {
|
||||
$xlpkg = Open-ExcelPackage -Path $xlPath
|
||||
$xlpkg = Open-ExcelPackage -ReadOnly -Path $xlPath
|
||||
$WorksheetNames = $xlPkg.Workbook.Worksheets.Name
|
||||
Close-ExcelPackage -nosave -ExcelPackage $xlpkg
|
||||
$WorksheetNames.where( {$_ -like "*$wordToComplete*"}) | foreach-object {
|
||||
|
||||
@@ -39,7 +39,7 @@ function New-ConditionalText {
|
||||
"Finish Position". The range could be written -Range "C:C" to specify a
|
||||
named column, or -Range "C2:C102" to specify certain cells in the column.
|
||||
.Link
|
||||
Add-Add-ConditionalFormatting
|
||||
Add-ConditionalFormatting
|
||||
New-ConditionalFormattingIconSet
|
||||
#>
|
||||
[cmdletbinding()]
|
||||
|
||||
@@ -97,11 +97,12 @@
|
||||
#>
|
||||
[Alias("New-ExcelChart")] #This was the former name. The new name reflects that we are defining a chart, not making one in the workbook.
|
||||
[cmdletbinding()]
|
||||
[Diagnostics.CodeAnalysis.SuppressMessageAttribute('PSUseShouldProcessForStateChangingFunctions', '',Justification='Does not change system State')]
|
||||
[Diagnostics.CodeAnalysis.SuppressMessageAttribute('PSUseShouldProcessForStateChangingFunctions', '', Justification = 'Does not change system State')]
|
||||
param(
|
||||
$Title = "Chart Title",
|
||||
$Header,
|
||||
[OfficeOpenXml.Drawing.Chart.eChartType]$ChartType = "ColumnStacked",
|
||||
[OfficeOpenXml.Drawing.Chart.eTrendLine[]]$ChartTrendLine,
|
||||
$XRange,
|
||||
$YRange,
|
||||
$Width = 500,
|
||||
@@ -138,11 +139,12 @@
|
||||
$YMinValue,
|
||||
[OfficeOpenXml.Drawing.Chart.eAxisPosition]$YAxisPosition
|
||||
)
|
||||
if ( $Header ) {Write-Warning "The header parameter is ignored."} #Nothing was done with it when creating a chart.
|
||||
if ( $Header ) { Write-Warning "The header parameter is ignored." } #Nothing was done with it when creating a chart.
|
||||
#might be able to do [PSCustomObject]$PsboundParameters, the defaults here match those in Add-Excel Chart
|
||||
[PSCustomObject]@{
|
||||
Title = $Title
|
||||
ChartType = $ChartType
|
||||
ChartTrendLine = $ChartTrendLine
|
||||
XRange = $XRange
|
||||
YRange = $YRange
|
||||
Width = $Width
|
||||
@@ -151,14 +153,14 @@
|
||||
RowOffSetPixels = $RowOffSetPixels
|
||||
Column = $Column
|
||||
ColumnOffSetPixels = $ColumnOffSetPixels
|
||||
LegendPosition = $LegendPosition
|
||||
LegendPosition = $LegendPosition
|
||||
LegendSize = $LegendSize
|
||||
Legendbold = $LegendBold
|
||||
NoLegend = $NoLegend -as [Boolean]
|
||||
NoLegend = $NoLegend -as [Boolean]
|
||||
ShowCategory = $ShowCategory -as [Boolean]
|
||||
ShowPercent = $ShowPercent -as [Boolean]
|
||||
ShowPercent = $ShowPercent -as [Boolean]
|
||||
SeriesHeader = $SeriesHeader
|
||||
TitleBold = $TitleBold -as [Boolean]
|
||||
TitleBold = $TitleBold -as [Boolean]
|
||||
TitleSize = $TitleSize
|
||||
XAxisTitleText = $XAxisTitleText
|
||||
XAxisTitleBold = $XAxisTitleBold -as [Boolean]
|
||||
@@ -170,7 +172,7 @@
|
||||
XMinValue = $XMinValue
|
||||
XAxisPosition = $XAxisPosition
|
||||
YAxisTitleText = $YAxisTitleText
|
||||
YAxisTitleBold = $YAxisTitleBold -as [Boolean]
|
||||
YAxisTitleBold = $YAxisTitleBold -as [Boolean]
|
||||
YAxisTitleSize = $YAxisTitleSize
|
||||
YAxisNumberformat = $YAxisNumberformat
|
||||
YMajorUnit = $YMajorUnit
|
||||
@@ -326,24 +328,25 @@ function Add-ExcelChart {
|
||||
and is marked off in units of 0.25 shown to two decimal places.
|
||||
The key will for the chart will be at the bottom in 8 point bold type and the line will be named "Sin(x)".
|
||||
#>
|
||||
[cmdletbinding(DefaultParameterSetName='Worksheet')]
|
||||
[cmdletbinding(DefaultParameterSetName = 'Worksheet')]
|
||||
[OutputType([OfficeOpenXml.Drawing.Chart.ExcelChart])]
|
||||
param(
|
||||
[Parameter(ParameterSetName='Workshet',Mandatory=$true)]
|
||||
[Parameter(ParameterSetName = 'Workshet', Mandatory = $true)]
|
||||
[OfficeOpenXml.ExcelWorksheet]$Worksheet,
|
||||
[Parameter(ParameterSetName='PivotTable',Mandatory=$true)]
|
||||
[Parameter(ParameterSetName = 'PivotTable', Mandatory = $true)]
|
||||
[OfficeOpenXml.Table.PivotTable.ExcelPivotTable]$PivotTable ,
|
||||
[String]$Title,
|
||||
#$Header, Not used but referenced previously
|
||||
[OfficeOpenXml.Drawing.Chart.eChartType]$ChartType = "ColumnStacked",
|
||||
[OfficeOpenXml.Drawing.Chart.eTrendLine[]]$ChartTrendLine,
|
||||
$XRange,
|
||||
$YRange,
|
||||
[int]$Width = 500,
|
||||
[int]$Height = 350,
|
||||
[int]$Row = 0,
|
||||
[int]$RowOffSetPixels = 10,
|
||||
[int]$Column = 6,
|
||||
[int]$ColumnOffSetPixels = 5,
|
||||
[int]$Width = 500,
|
||||
[int]$Height = 350,
|
||||
[int]$Row = 0,
|
||||
[int]$RowOffSetPixels = 10,
|
||||
[int]$Column = 6,
|
||||
[int]$ColumnOffSetPixels = 5,
|
||||
[OfficeOpenXml.Drawing.Chart.eLegendPosition]$LegendPosition,
|
||||
$LegendSize,
|
||||
[Switch]$LegendBold,
|
||||
@@ -372,11 +375,11 @@ function Add-ExcelChart {
|
||||
$YMinValue,
|
||||
[OfficeOpenXml.Drawing.Chart.eAxisPosition]$YAxisPosition,
|
||||
[Switch]$PassThru
|
||||
)
|
||||
)
|
||||
try {
|
||||
if ($PivotTable) {
|
||||
$Worksheet = $PivotTable.WorkSheet
|
||||
$chart = $Worksheet.Drawings.AddChart(("Chart" + $PivotTable.Name ),$ChartType,$PivotTable)
|
||||
$chart = $Worksheet.Drawings.AddChart(("Chart" + $PivotTable.Name ), $ChartType, $PivotTable)
|
||||
}
|
||||
else {
|
||||
$ChartName = 'Chart' + (Split-Path -Leaf ([System.IO.path]::GetTempFileName())) -replace 'tmp|\.', ''
|
||||
@@ -384,75 +387,85 @@ function Add-ExcelChart {
|
||||
$chartDefCount = @($YRange).Count
|
||||
if ($chartDefCount -eq 1) {
|
||||
$Series = $chart.Series.Add($YRange, $XRange)
|
||||
if ($SeriesHeader) { $Series.Header = $SeriesHeader}
|
||||
else { $Series.Header = 'Series 1'}
|
||||
if ($ChartTrendLine) {
|
||||
if ($ChartType -notmatch "stacked|3D$|pie|Doughnut|Cone|Cylinder|Pyramid") {
|
||||
foreach ($trendLine in $ChartTrendLine) {
|
||||
$null = $Series.TrendLines.Add($trendLine)
|
||||
}
|
||||
}
|
||||
else {
|
||||
Write-Warning "Chart trend line is not supported for chart type: $ChartType"
|
||||
}
|
||||
}
|
||||
if ($SeriesHeader) { $Series.Header = $SeriesHeader }
|
||||
else { $Series.Header = 'Series 1' }
|
||||
}
|
||||
else {
|
||||
for ($idx = 0; $idx -lt $chartDefCount; $idx += 1) {
|
||||
if ($Yrange.count -eq $xrange.count) {
|
||||
$Series = $chart.Series.Add($YRange[$idx], $XRange[$idx])
|
||||
$Series = $chart.Series.Add($YRange[$idx], $XRange[$idx])
|
||||
}
|
||||
else {
|
||||
$Series = $chart.Series.Add($YRange[$idx], $XRange)
|
||||
$Series = $chart.Series.Add($YRange[$idx], $XRange)
|
||||
}
|
||||
if ($SeriesHeader.Count -gt 0) {
|
||||
if ($SeriesHeader[$idx] -match '^=') {$Series.HeaderAddress = $SeriesHeader[$idx] -replace '^=',''}
|
||||
else {$Series.Header = $SeriesHeader[$idx] }
|
||||
if ($SeriesHeader[$idx] -match '^=') { $Series.HeaderAddress = $SeriesHeader[$idx] -replace '^=', '' }
|
||||
else { $Series.Header = $SeriesHeader[$idx] }
|
||||
}
|
||||
else { $Series.Header = "Series $($idx)"}
|
||||
else { $Series.Header = "Series $($idx)" }
|
||||
}
|
||||
}
|
||||
}
|
||||
if ($Title) {
|
||||
$chart.Title.Text = $Title
|
||||
if ($TitleBold) {$chart.Title.Font.Bold = $true}
|
||||
if ($TitleSize) {$chart.Title.Font.Size = $TitleSize}
|
||||
if ($TitleBold) { $chart.Title.Font.Bold = $true }
|
||||
if ($TitleSize) { $chart.Title.Font.Size = $TitleSize }
|
||||
}
|
||||
if ($NoLegend) { $chart.Legend.Remove() }
|
||||
else {
|
||||
if ($PSBoundParameters.ContainsKey('LegendPosition')) {$chart.Legend.Position = $LegendPosition}
|
||||
if ($PSBoundParameters.ContainsKey('LegendBold')) {$chart.Legend.Font.Bold = [boolean]$LegendBold}
|
||||
if ($LegendSize) {$chart.Legend.Font.Size = $LegendSize}
|
||||
if ($PSBoundParameters.ContainsKey('LegendPosition')) { $chart.Legend.Position = $LegendPosition }
|
||||
if ($PSBoundParameters.ContainsKey('LegendBold')) { $chart.Legend.Font.Bold = [boolean]$LegendBold }
|
||||
if ($LegendSize) { $chart.Legend.Font.Size = $LegendSize }
|
||||
}
|
||||
|
||||
if ($XAxisTitleText) {
|
||||
if ($XAxisTitleText) {
|
||||
$chart.XAxis.Title.Text = $XAxisTitleText
|
||||
if ($PSBoundParameters.ContainsKey('XAxisTitleBold')) {
|
||||
$chart.XAxis.Title.Font.Bold = [boolean]$XAxisTitleBold
|
||||
if ($PSBoundParameters.ContainsKey('XAxisTitleBold')) {
|
||||
$chart.XAxis.Title.Font.Bold = [boolean]$XAxisTitleBold
|
||||
}
|
||||
if ($XAxisTitleSize) {$chart.XAxis.Title.Font.Size = $XAxisTitleSize}
|
||||
if ($XAxisTitleSize) { $chart.XAxis.Title.Font.Size = $XAxisTitleSize }
|
||||
}
|
||||
if ($XAxisPosition) {Write-Warning "X-axis position is not being set propertly at the moment, parameter ignored" }
|
||||
#$chart.ChartXml.chartSpace.chart.plotArea.catAx.axPos.val = $XAxisPosition.ToString().substring(0,1)}
|
||||
if ($XMajorUnit) {$chart.XAxis.MajorUnit = $XMajorUnit}
|
||||
if ($XMinorUnit) {$chart.XAxis.MinorUnit = $XMinorUnit}
|
||||
if ($null -ne $XMinValue) {$chart.XAxis.MinValue = $XMinValue}
|
||||
if ($null -ne $XMaxValue) {$chart.XAxis.MaxValue = $XMaxValue}
|
||||
if ($XAxisNumberformat) {$chart.XAxis.Format = (Expand-NumberFormat $XAxisNumberformat)}
|
||||
if ($XAxisPosition) { Write-Warning "X-axis position is not being set propertly at the moment, parameter ignored" }
|
||||
#$chart.ChartXml.chartSpace.chart.plotArea.catAx.axPos.val = $XAxisPosition.ToString().substring(0,1)}
|
||||
if ($XMajorUnit) { $chart.XAxis.MajorUnit = $XMajorUnit }
|
||||
if ($XMinorUnit) { $chart.XAxis.MinorUnit = $XMinorUnit }
|
||||
if ($null -ne $XMinValue) { $chart.XAxis.MinValue = $XMinValue }
|
||||
if ($null -ne $XMaxValue) { $chart.XAxis.MaxValue = $XMaxValue }
|
||||
if ($XAxisNumberformat) { $chart.XAxis.Format = (Expand-NumberFormat $XAxisNumberformat) }
|
||||
|
||||
if ($YAxisTitleText) {
|
||||
if ($YAxisTitleText) {
|
||||
$chart.YAxis.Title.Text = $YAxisTitleText
|
||||
if ($PSBoundParameters.ContainsKey('YAxisTitleBold')) {
|
||||
$chart.YAxis.Title.Font.Bold = [boolean]$YAxisTitleBold
|
||||
$chart.YAxis.Title.Font.Bold = [boolean]$YAxisTitleBold
|
||||
}
|
||||
if ($YAxisTitleSize) {$chart.YAxis.Title.Font.Size = $YAxisTitleSize}
|
||||
if ($YAxisTitleSize) { $chart.YAxis.Title.Font.Size = $YAxisTitleSize }
|
||||
}
|
||||
if ($YAxisPosition) {Write-Warning "Y-axis position is not being set propertly at the moment, parameter ignored" }
|
||||
#$chart.ChartXml.chartSpace.chart.plotArea.valAx.axPos.val= $YAxisPosition.ToString().substring(0,1)}
|
||||
if ($YMajorUnit) {$chart.YAxis.MajorUnit = $YMajorUnit}
|
||||
if ($YMinorUnit) {$chart.YAxis.MinorUnit = $YMinorUnit}
|
||||
if ($null -ne $YMinValue){$chart.YAxis.MinValue = $YMinValue}
|
||||
if ($null -ne $YMaxValue){$chart.YAxis.MaxValue = $YMaxValue}
|
||||
if ($YAxisNumberformat) {$chart.YAxis.Format = (Expand-NumberFormat $YAxisNumberformat)}
|
||||
if ($YAxisPosition) { Write-Warning "Y-axis position is not being set propertly at the moment, parameter ignored" }
|
||||
#$chart.ChartXml.chartSpace.chart.plotArea.valAx.axPos.val= $YAxisPosition.ToString().substring(0,1)}
|
||||
if ($YMajorUnit) { $chart.YAxis.MajorUnit = $YMajorUnit }
|
||||
if ($YMinorUnit) { $chart.YAxis.MinorUnit = $YMinorUnit }
|
||||
if ($null -ne $YMinValue) { $chart.YAxis.MinValue = $YMinValue }
|
||||
if ($null -ne $YMaxValue) { $chart.YAxis.MaxValue = $YMaxValue }
|
||||
if ($YAxisNumberformat) { $chart.YAxis.Format = (Expand-NumberFormat $YAxisNumberformat) }
|
||||
if ($null -ne $chart.Datalabel) {
|
||||
$chart.Datalabel.ShowCategory = [boolean]$ShowCategory
|
||||
$chart.Datalabel.ShowPercent = [boolean]$ShowPercent
|
||||
$chart.Datalabel.ShowCategory = [boolean]$ShowCategory
|
||||
$chart.Datalabel.ShowPercent = [boolean]$ShowPercent
|
||||
}
|
||||
|
||||
$chart.SetPosition($Row, $RowOffsetPixels, $Column, $ColumnOffsetPixels)
|
||||
$chart.SetSize($Width, $Height)
|
||||
|
||||
if ($PassThru) {return $chart}
|
||||
if ($PassThru) { return $chart }
|
||||
}
|
||||
catch {Write-Warning -Message "Failed adding Chart to worksheet '$($WorkSheet).name': $_"}
|
||||
catch { Write-Warning -Message "Failed adding Chart to worksheet '$($WorkSheet).name': $_" }
|
||||
}
|
||||
|
||||
@@ -53,6 +53,15 @@ Install-Module ImportExcel -scope CurrentUser
|
||||
Install-Module ImportExcel
|
||||
```
|
||||
|
||||
# What's new 6.2.0
|
||||
Thank you to [James O'Neill](https://github.com/jhoneill)
|
||||
|
||||
- Fixed, Import-Excel can read xlsx files even if already open in Excel
|
||||
- Added `New-ExcelStyle`, plus `-Style` to `Export-Excel` and `-Merge` to `Set-ExcelRange`
|
||||
- Added [Style Examples](https://github.com/dfinke/ImportExcel/tree/master/Examples/Styles)
|
||||
|
||||
|
||||
|
||||
# What's new 6.1.0
|
||||
|
||||
Thank you to [James O'Neill](https://github.com/jhoneill)
|
||||
|
||||
113
SetFormat.ps1
113
SetFormat.ps1
@@ -1,4 +1,4 @@
|
||||
Function Set-ExcelRange {
|
||||
function Set-ExcelRange {
|
||||
<#
|
||||
.SYNOPSIS
|
||||
Applies number, font, alignment and/or color formatting, values or formulas to a range of Excel cells.
|
||||
@@ -56,6 +56,7 @@
|
||||
#Style for the right border.
|
||||
[OfficeOpenXml.Style.ExcelBorderStyle]$BorderRight,
|
||||
#Colour for the text - if none is specified it will be left as it is.
|
||||
[Alias('ForegroundColor')]
|
||||
$FontColor,
|
||||
#Value for the cell.
|
||||
$Value,
|
||||
@@ -107,7 +108,9 @@
|
||||
#Hide a row or column (not a range); use -Hidden:$false to unhide.
|
||||
[Switch]$Hidden,
|
||||
#Locks cells. Cells are locked by default use -locked:$false on the whole sheet and then lock specific ones, and enable protection on the sheet.
|
||||
[Switch]$Locked
|
||||
[Switch]$Locked,
|
||||
#Merges cells - it is recommended that you explicitly set -HorizontalAlignment
|
||||
[Switch]$Merge
|
||||
)
|
||||
process {
|
||||
if ($Range -is [Array]) {
|
||||
@@ -168,6 +171,9 @@
|
||||
if ($PSBoundParameters.ContainsKey('VerticalAlignment')) {
|
||||
$Range.Style.VerticalAlignment = $VerticalAlignment
|
||||
}
|
||||
if ($PSBoundParameters.ContainsKey('Merge')) {
|
||||
$Range.Merge = [boolean]$Merge
|
||||
}
|
||||
if ($PSBoundParameters.ContainsKey('Value')) {
|
||||
if ($Value -match '^=') {$PSBoundParameters["Formula"] = $Value -replace '^=','' }
|
||||
else {
|
||||
@@ -251,7 +257,7 @@
|
||||
}
|
||||
}
|
||||
|
||||
Function NumberFormatCompletion {
|
||||
function NumberFormatCompletion {
|
||||
param($commandName, $parameterName, $wordToComplete, $commandAst, $fakeBoundParameter)
|
||||
$numformats = [ordered]@{
|
||||
"General" = "General" # format ID 0
|
||||
@@ -294,6 +300,7 @@ Function NumberFormatCompletion {
|
||||
if (Get-Command -ErrorAction SilentlyContinue -name Register-ArgumentCompleter) {
|
||||
Register-ArgumentCompleter -CommandName Add-ConditionalFormatting -ParameterName NumberFormat -ScriptBlock $Function:NumberFormatCompletion
|
||||
Register-ArgumentCompleter -CommandName Export-Excel -ParameterName NumberFormat -ScriptBlock $Function:NumberFormatCompletion
|
||||
Register-ArgumentCompleter -CommandName New-ExcelStyle -ParameterName NumberFormat -ScriptBlock $Function:NumberFormatCompletion
|
||||
Register-ArgumentCompleter -CommandName Set-ExcelRange -ParameterName NumberFormat -ScriptBlock $Function:NumberFormatCompletion
|
||||
Register-ArgumentCompleter -CommandName Set-ExcelColumn -ParameterName NumberFormat -ScriptBlock $Function:NumberFormatCompletion
|
||||
Register-ArgumentCompleter -CommandName Set-ExcelRow -ParameterName NumberFormat -ScriptBlock $Function:NumberFormatCompletion
|
||||
@@ -305,7 +312,27 @@ if (Get-Command -ErrorAction SilentlyContinue -name Register-ArgumentCompleter)
|
||||
Register-ArgumentCompleter -CommandName Add-ExcelChart -ParameterName YAxisNumberformat -ScriptBlock $Function:NumberFormatCompletion
|
||||
}
|
||||
|
||||
Function Expand-NumberFormat {
|
||||
function ListFonts {
|
||||
param($commandName, $parameterName, $wordToComplete, $commandAst, $fakeBoundParameter)
|
||||
if (-not $script:FontFamilies) {
|
||||
$script:FontFamilies = @("","")
|
||||
try {
|
||||
$script:FontFamilies = (New-Object System.Drawing.Text.InstalledFontCollection).Families.Name
|
||||
}
|
||||
catch {}
|
||||
}
|
||||
$script:FontFamilies.where({$_ -Gt "" -and $_ -like "$wordToComplete*"} ) | ForEach-Object {
|
||||
New-Object -TypeName System.Management.Automation.CompletionResult -ArgumentList "'$_'" , $_ ,
|
||||
([System.Management.Automation.CompletionResultType]::ParameterValue) , $_
|
||||
}
|
||||
}
|
||||
if (Get-Command -ErrorAction SilentlyContinue -name Register-ArgumentCompleter) {
|
||||
Register-ArgumentCompleter -CommandName New-ExcelStyle -ParameterName FontName -ScriptBlock $Function:ListFonts
|
||||
Register-ArgumentCompleter -CommandName Set-ExcelColumn -ParameterName FontName -ScriptBlock $Function:ListFonts
|
||||
Register-ArgumentCompleter -CommandName Set-ExcelRange -ParameterName FontName -ScriptBlock $Function:ListFonts
|
||||
Register-ArgumentCompleter -CommandName Set-ExcelRow -ParameterName FontName -ScriptBlock $Function:ListFonts
|
||||
}
|
||||
function Expand-NumberFormat {
|
||||
<#
|
||||
.SYNOPSIS
|
||||
Converts short names for number formats to the formatting strings used in Excel
|
||||
@@ -381,3 +408,81 @@ Function Expand-NumberFormat {
|
||||
Default {return $NumberFormat}
|
||||
}
|
||||
}
|
||||
|
||||
function New-ExcelStyle {
|
||||
param (
|
||||
[Alias("Address")]
|
||||
$Range ,
|
||||
#Number format to apply to cells e.g. "dd/MM/yyyy HH:mm", "£#,##0.00;[Red]-£#,##0.00", "0.00%" , "##/##" , "0.0E+0" etc.
|
||||
[Alias("NFormat")]
|
||||
$NumberFormat,
|
||||
#Style of border to draw around the range.
|
||||
[OfficeOpenXml.Style.ExcelBorderStyle]$BorderAround,
|
||||
#Color of the border.
|
||||
$BorderColor=[System.Drawing.Color]::Black,
|
||||
#Style for the bottom border.
|
||||
[OfficeOpenXml.Style.ExcelBorderStyle]$BorderBottom,
|
||||
#Style for the top border.
|
||||
[OfficeOpenXml.Style.ExcelBorderStyle]$BorderTop,
|
||||
#Style for the left border.
|
||||
[OfficeOpenXml.Style.ExcelBorderStyle]$BorderLeft,
|
||||
#Style for the right border.
|
||||
[OfficeOpenXml.Style.ExcelBorderStyle]$BorderRight,
|
||||
#Colour for the text - if none is specified it will be left as it is.
|
||||
[Alias('ForegroundColor')]
|
||||
$FontColor,
|
||||
#Value for the cell.
|
||||
$Value,
|
||||
#Formula for the cell.
|
||||
$Formula,
|
||||
#Specifies formula should be an array formula (a.k.a CSE [ctrl-shift-enter] formula).
|
||||
[Switch]$ArrayFormula,
|
||||
#Clear Bold, Italic, StrikeThrough and Underline and set color to Black.
|
||||
[Switch]$ResetFont,
|
||||
#Make text bold; use -Bold:$false to remove bold.
|
||||
[Switch]$Bold,
|
||||
#Make text italic; use -Italic:$false to remove italic.
|
||||
[Switch]$Italic,
|
||||
#Underline the text using the underline style in -UnderlineType; use -Underline:$false to remove underlining.
|
||||
[Switch]$Underline,
|
||||
#Specifies whether underlining should be single or double, normal or accounting mode. The default is "Single".
|
||||
[OfficeOpenXml.Style.ExcelUnderLineType]$UnderLineType = [OfficeOpenXml.Style.ExcelUnderLineType]::Single,
|
||||
#Strike through text; use -Strikethru:$false to remove Strike through
|
||||
[Switch]$StrikeThru,
|
||||
#Subscript or Superscript (or none).
|
||||
[OfficeOpenXml.Style.ExcelVerticalAlignmentFont]$FontShift,
|
||||
#Font to use - Excel defaults to Calibri.
|
||||
[String]$FontName,
|
||||
#Point size for the text.
|
||||
[float]$FontSize,
|
||||
#Change background color.
|
||||
$BackgroundColor,
|
||||
#Background pattern - Solid by default.
|
||||
[OfficeOpenXml.Style.ExcelFillStyle]$BackgroundPattern = [OfficeOpenXml.Style.ExcelFillStyle]::Solid ,
|
||||
#Secondary color for background pattern.
|
||||
[Alias("PatternColour")]
|
||||
$PatternColor,
|
||||
#Turn on Text-Wrapping; use -WrapText:$false to turn off wrapping.
|
||||
[Switch]$WrapText,
|
||||
#Position cell contents to Left, Right, Center etc. default is 'General'.
|
||||
[OfficeOpenXml.Style.ExcelHorizontalAlignment]$HorizontalAlignment,
|
||||
#Position cell contents to Top, Bottom or Center.
|
||||
[OfficeOpenXml.Style.ExcelVerticalAlignment]$VerticalAlignment,
|
||||
#Degrees to rotate text. Up to +90 for anti-clockwise ("upwards"), or to -90 for clockwise.
|
||||
[ValidateRange(-90, 90)]
|
||||
[int]$TextRotation ,
|
||||
#Autofit cells to width (columns or ranges only).
|
||||
[Alias("AutoFit")]
|
||||
[Switch]$AutoSize,
|
||||
#Set cells to a fixed width (columns or ranges only), ignored if Autosize is specified.
|
||||
[float]$Width,
|
||||
#Set cells to a fixed height (rows or ranges only).
|
||||
[float]$Height,
|
||||
#Hide a row or column (not a range); use -Hidden:$false to unhide.
|
||||
[Switch]$Hidden,
|
||||
#Locks cells. Cells are locked by default use -locked:$false on the whole sheet and then lock specific ones, and enable protection on the sheet.
|
||||
[Switch]$Locked,
|
||||
[Switch]$Merge
|
||||
)
|
||||
$PSBoundParameters
|
||||
}
|
||||
49
__tests__/AddTrendlinesToAChart.tests.ps1
Normal file
49
__tests__/AddTrendlinesToAChart.tests.ps1
Normal file
@@ -0,0 +1,49 @@
|
||||
Describe "Test adding trendlines to charts" {
|
||||
BeforeAll {
|
||||
$script:data = ConvertFrom-Csv @"
|
||||
Region,Item,TotalSold
|
||||
West,screws,60
|
||||
South,lemon,48
|
||||
South,apple,71
|
||||
East,screwdriver,70
|
||||
East,kiwi,32
|
||||
West,screwdriver,1
|
||||
South,melon,21
|
||||
East,apple,79
|
||||
South,apple,68
|
||||
South,avocado,73
|
||||
"@
|
||||
|
||||
}
|
||||
|
||||
BeforeEach {
|
||||
$xlfile = "$env:TEMP\trendLine.xlsx"
|
||||
Remove-Item $xlfile -ErrorAction SilentlyContinue
|
||||
}
|
||||
|
||||
It "Should add a linear trendline" {
|
||||
|
||||
$cd = New-ExcelChartDefinition -XRange Region -YRange TotalSold -ChartType ColumnClustered -ChartTrendLine Linear
|
||||
$data | Export-Excel $xlfile -ExcelChartDefinition $cd -AutoNameRange
|
||||
|
||||
$excel = Open-ExcelPackage -Path $xlfile
|
||||
$ws = $excel.Workbook.Worksheets["Sheet1"]
|
||||
|
||||
$ws.Drawings[0].Series.TrendLines.Type | Should Be 'Linear'
|
||||
|
||||
Close-ExcelPackage $excel
|
||||
}
|
||||
|
||||
It "Should add a MovingAvgerage trendline" {
|
||||
|
||||
$cd = New-ExcelChartDefinition -XRange Region -YRange TotalSold -ChartType ColumnClustered -ChartTrendLine MovingAvgerage
|
||||
$data | Export-Excel $xlfile -ExcelChartDefinition $cd -AutoNameRange
|
||||
|
||||
$excel = Open-ExcelPackage -Path $xlfile
|
||||
$ws = $excel.Workbook.Worksheets["Sheet1"]
|
||||
|
||||
$ws.Drawings[0].Series.TrendLines.Type | Should Be 'MovingAvgerage'
|
||||
|
||||
Close-ExcelPackage $excel
|
||||
}
|
||||
}
|
||||
@@ -1,6 +1,6 @@
|
||||
Import-Module $PSScriptRoot\..\ImportExcel.psd1 -Force
|
||||
|
||||
$xlFile = ".\testSQL.xlsx"
|
||||
$xlFile = "$env:TEMP\testSQL.xlsx"
|
||||
|
||||
Describe "ConvertFrom-ExcelToSQLInsert" {
|
||||
|
||||
|
||||
@@ -12,4 +12,4 @@ steps:
|
||||
trigger:
|
||||
paths:
|
||||
exclude:
|
||||
- README.md
|
||||
- README.md
|
||||
|
||||
BIN
images/NewExcelStyle.png
Normal file
BIN
images/NewExcelStyle.png
Normal file
Binary file not shown.
|
After Width: | Height: | Size: 49 KiB |
Reference in New Issue
Block a user