mirror of
https://github.com/dfinke/ImportExcel.git
synced 2025-12-15 15:53:32 +00:00
Compare commits
106 Commits
| Author | SHA1 | Date | |
|---|---|---|---|
|
|
d1f41012a1 | ||
|
|
0fbe9dbc9b | ||
|
|
e0b2d15c53 | ||
|
|
34c924ae19 | ||
|
|
9217962306 | ||
|
|
56acf56430 | ||
|
|
ef9be471ab | ||
|
|
9db2bc068e | ||
|
|
9560ea83f9 | ||
|
|
9c79ba573c | ||
|
|
894e645a47 | ||
|
|
f3dc390bfa | ||
|
|
f0f58f84a0 | ||
|
|
7ded24d2f9 | ||
|
|
cf964e3e4f | ||
|
|
8c5b3b2f5f | ||
|
|
8409adeeba | ||
|
|
153d4d8c45 | ||
|
|
69f9ba7d17 | ||
|
|
e4deb5801e | ||
|
|
1a74c0f0d0 | ||
|
|
72e44da219 | ||
|
|
bef2f29651 | ||
|
|
787dda70ee | ||
|
|
285e9e4949 | ||
|
|
01e3ea206d | ||
|
|
6f3420d11e | ||
|
|
2981bf23b1 | ||
|
|
c5cc018eb5 | ||
|
|
268d48ce3d | ||
|
|
eca631670c | ||
|
|
284560e109 | ||
|
|
234615dfdb | ||
|
|
d31cd04781 | ||
|
|
77481f2901 | ||
|
|
54fec69f88 | ||
|
|
1dc9a02d7d | ||
|
|
f86fdbab22 | ||
|
|
66937db040 | ||
|
|
80520299aa | ||
|
|
2753a6876a | ||
|
|
ade442b18c | ||
|
|
45ba112f73 | ||
|
|
e1fe36699b | ||
|
|
b3f4b188da | ||
|
|
0ce75794e6 | ||
|
|
3afe2059e5 | ||
|
|
66b7b64779 | ||
|
|
d90cd6d2d0 | ||
|
|
1d1f266fb6 | ||
|
|
4945b4d6e3 | ||
|
|
21b5a11aca | ||
|
|
d1976bf3a9 | ||
|
|
ffcdd39ae9 | ||
|
|
b4b5e75d28 | ||
|
|
4c3eb792d6 | ||
|
|
c4ef920bdf | ||
|
|
d81c2055e9 | ||
|
|
4528f3b052 | ||
|
|
5acec641fe | ||
|
|
04d06ff008 | ||
|
|
1974beef2d | ||
|
|
49f0c97635 | ||
|
|
0710724e2d | ||
|
|
a6438d468a | ||
|
|
ce92461efc | ||
|
|
b3c4a334b5 | ||
|
|
6b2190bfff | ||
|
|
5822ef330e | ||
|
|
d78e3fff98 | ||
|
|
85bd85ee69 | ||
|
|
04e8faaccc | ||
|
|
2c062a4e5d | ||
|
|
80c1a945f0 | ||
|
|
1d5ec26b04 | ||
|
|
860b2724f5 | ||
|
|
c38648a654 | ||
|
|
dcd730a4d1 | ||
|
|
0fdaeb977b | ||
|
|
61173d5e40 | ||
|
|
d26f0c66dd | ||
|
|
fe4fcff444 | ||
|
|
01c58faea8 | ||
|
|
dce2f6d108 | ||
|
|
49afad6977 | ||
|
|
b7add5f9e1 | ||
|
|
c07fc81dfe | ||
|
|
3835ceeebb | ||
|
|
6683bed799 | ||
|
|
20aade4bdd | ||
|
|
b6965e0724 | ||
|
|
9d85c6cb81 | ||
|
|
a17fc95415 | ||
|
|
ecb045274a | ||
|
|
e5c4a715d6 | ||
|
|
e27e98a9eb | ||
|
|
9da8bf8bf7 | ||
|
|
50905c7989 | ||
|
|
91a7c17341 | ||
|
|
3c18af50b9 | ||
|
|
66f5d09ace | ||
|
|
fa64299760 | ||
|
|
c36e5fb582 | ||
|
|
5158addc36 | ||
|
|
bf2e37ac9f | ||
|
|
d22d40cdc2 |
4
.gitignore
vendored
4
.gitignore
vendored
@@ -2,6 +2,8 @@
|
||||
Thumbs.db
|
||||
ehthumbs.db
|
||||
|
||||
*.gitignore
|
||||
|
||||
# Folder config file
|
||||
Desktop.ini
|
||||
|
||||
@@ -14,6 +16,8 @@ $RECYCLE.BIN/
|
||||
*.msm
|
||||
*.msp
|
||||
|
||||
*.dll
|
||||
|
||||
# Windows shortcuts
|
||||
*.lnk
|
||||
|
||||
|
||||
3
.vscode/spellright.dict
vendored
3
.vscode/spellright.dict
vendored
@@ -32,3 +32,6 @@ enums
|
||||
Numberformat
|
||||
ChartDefiniton
|
||||
hashtables
|
||||
Agramont
|
||||
AGramont
|
||||
Jhoneill
|
||||
|
||||
@@ -1,46 +1,97 @@
|
||||
Function Add-ConditionalFormatting {
|
||||
<#
|
||||
.Synopsis
|
||||
Adds conditional formatting to worksheet.
|
||||
Adds conditional formatting to all or part of a worksheet.
|
||||
.Description
|
||||
Conditional formatting allows excel to
|
||||
* Mark cells with Icons depending on their value
|
||||
* Show a databar whose length indicates the value or a 2 or 3 color scale where the color indicate the relative value
|
||||
Conditional formatting allows Excel to:
|
||||
* Mark cells with icons depending on their value
|
||||
* Show a databar whose length indicates the value or a two or three color scale where the color indicates the relative value
|
||||
* Change the color, font, or number format of cells which meet given criteria
|
||||
Add-ConditionalFormatting allows these to be set; for fine tuning of the rules you can use the -PassThru switch,
|
||||
which will return the rule so that you can modify things which are specific to that type of rule,
|
||||
for example the values which correspond to each icon in an Icon set.
|
||||
Add-ConditionalFormatting allows these parameters to be set; for fine tuning of
|
||||
the rules, the -PassThru switch will return the rule so that you can modify
|
||||
things which are specific to that type of rule, example, the values which
|
||||
correspond to each icon in an Icon-Set.
|
||||
.Example
|
||||
>
|
||||
PS> $excel = $avdata | Export-Excel -Path (Join-path $FilePath "\Machines.XLSX" ) -WorksheetName "Server Anti-Virus" -AutoSize -FreezeTopRow -AutoFilter -PassThru
|
||||
$excel = $avdata | Export-Excel -Path (Join-path $FilePath "\Machines.XLSX" ) -WorksheetName "Server Anti-Virus" -AutoSize -FreezeTopRow -AutoFilter -PassThru
|
||||
Add-ConditionalFormatting -WorkSheet $excel.Workbook.Worksheets[1] -Address "b2:b1048576" -ForeGroundColor "RED" -RuleType ContainsText -ConditionValue "2003"
|
||||
Add-ConditionalFormatting -WorkSheet $excel.Workbook.Worksheets[1] -Address "i2:i1048576" -ForeGroundColor "RED" -RuleType ContainsText -ConditionValue "Disabled"
|
||||
$excel.Workbook.Worksheets[1].Cells["D1:G1048576"].Style.Numberformat.Format = [cultureinfo]::CurrentCulture.DateTimeFormat.ShortDatePattern
|
||||
$excel.Workbook.Worksheets[1].Row(1).style.font.bold = $true
|
||||
$excel.Save() ; $excel.Dispose()
|
||||
|
||||
Here Export-Excel is called with the -passThru parameter so the Excel Package object is stored in $Excel
|
||||
The desired worksheet is selected and the then columns" B" and "I" are conditionally formatted (excluding the top row) to show red text if
|
||||
the columns contain "2003" or "Disabled respectively. A fixed date format is then applied to columns D..G, and the top row is formatted.
|
||||
Finally the workbook is saved and the Excel object closed.
|
||||
Here Export-Excel is called with the -PassThru parameter so the ExcelPackage object
|
||||
representing Machines.XLSX is stored in $Excel.The desired worksheet is selected
|
||||
and then columns" B" and "I" are conditionally formatted (excluding the top row)
|
||||
to show red text if they contain "2003" or "Disabled" respectively.
|
||||
A fixed date format is then applied to columns D to G, and the top row is formatted.
|
||||
Finally the workbook is saved and the Excel package object is closed.
|
||||
.Example
|
||||
>
|
||||
>PS $r = Add-ConditionalFormatting -WorkSheet $excel.Workbook.Worksheets[1] -Range "B1:B100" -ThreeIconsSet Flags -Passthru
|
||||
$r = Add-ConditionalFormatting -WorkSheet $excel.Workbook.Worksheets[1] -Range "B1:B100" -ThreeIconsSet Flags -Passthru
|
||||
$r.Reverse = $true ; $r.Icon1.Type = "Num"; $r.Icon2.Type = "Num" ; $r.Icon2.value = 100 ; $r.Icon3.type = "Num" ;$r.Icon3.value = 1000
|
||||
|
||||
Again Export-Excel has been called with -passthru leaving a package object in $Excel
|
||||
This time B1:B100 has been conditionally formatted with 3 icons, using the flags icon set.
|
||||
Add-ConditionalFormatting does not provide access to every option in the formatting rule, so passthru has been used and the
|
||||
rule is modified to apply the flags in reverse order, and boundaries for the number which will set the split are set to 100 and 1000
|
||||
Again Export-Excel has been called with -PassThru leaving a package object
|
||||
in $Excel. This time B1:B100 has been conditionally formatted with 3 icons,
|
||||
using the "Flags" Icon-Set. Add-ConditionalFormatting does not provide access
|
||||
to every option in the formatting rule, so -PassThru has been used and the
|
||||
rule is modified to apply the flags in reverse order, and transitions
|
||||
between flags are set to 100 and 1000.
|
||||
.Example
|
||||
Add-ConditionalFormatting -WorkSheet $sheet -Range "D2:D1048576" -DataBarColor Red
|
||||
|
||||
This time $sheet holds an ExcelWorkseet object and databars are add to all of column D except for the tip row.
|
||||
This time $sheet holds an ExcelWorkshseet object and databars are added to
|
||||
column D, excluding the top row.
|
||||
.Example
|
||||
Add-ConditionalFormatting -Address $worksheet.cells["FinishPosition"] -RuleType Equal -ConditionValue 1 -ForeGroundColor Purple -Bold -Priority 1 -StopIfTrue
|
||||
Add-ConditionalFormatting -Address $worksheet.cells["FinishPosition"] -RuleType Equal -ConditionValue 1 -ForeGroundColor Purple -Bold -Priority 1 -StopIfTrue
|
||||
|
||||
In this example a named range is used to select the cells where the condition
|
||||
should apply, and instead of specifying a sheet and range within the sheet as
|
||||
separate parameters, the cells where the format should apply are specified
|
||||
directly. If a cell in the "FinishPosition" range is 1, then the text is
|
||||
turned to Bold & Purple. This rule is moved to first in the priority list,
|
||||
and where cells have a value of 1, no other rules will be processed.
|
||||
.Example
|
||||
>
|
||||
$excel = Get-ChildItem | Select-Object -Property Name,Length,LastWriteTime,CreationTime | Export-Excel "$env:temp\test43.xlsx" -PassThru -AutoSize
|
||||
$ws = $excel.Workbook.Worksheets["Sheet1"]
|
||||
$ws.Cells["E1"].Value = "SavedAt"
|
||||
$ws.Cells["F1"].Value = [datetime]::Now
|
||||
$ws.Cells["F1"].Style.Numberformat.Format = (Expand-NumberFormat -NumberFormat 'Date-Time')
|
||||
$lastRow = $ws.Dimension.End.Row
|
||||
|
||||
Add-ConditionalFormatting -WorkSheet $ws -address "A2:A$Lastrow" -RuleType LessThan -ConditionValue "A" -ForeGroundColor Gray
|
||||
Add-ConditionalFormatting -WorkSheet $ws -address "B2:B$Lastrow" -RuleType GreaterThan -ConditionValue 1000000 -NumberFormat '#,###,,.00"M"'
|
||||
Add-ConditionalFormatting -WorkSheet $ws -address "C2:C$Lastrow" -RuleType GreaterThan -ConditionValue "=INT($F$1-7)" -ForeGroundColor Green -StopIfTrue
|
||||
Add-ConditionalFormatting -WorkSheet $ws -address "D2:D$Lastrow" -RuleType Equal -ConditionValue "=C2" -ForeGroundColor Blue -StopIfTrue
|
||||
|
||||
Close-ExcelPackage -Show $excel
|
||||
|
||||
The first few lines of code export a list of file and directory names, sizes
|
||||
and dates to a spreadsheet. It puts the date of the export in cell F1.
|
||||
The first Conditional format changes the color of files and folders that begin
|
||||
with a ".", "_" or anything else which sorts before "A".
|
||||
The second Conditional format changes the Number format of numbers bigger than
|
||||
1 million, for example 1,234,567,890 will dispay as "1,234.57M"
|
||||
The third highlights datestamps of files less than a week old when the export
|
||||
was run; the = is necessary in the condition value otherwise the rule will
|
||||
look for the the text INT($F$1-7), and the cell address for the date is fixed
|
||||
using the standard Excel $ notation.
|
||||
The final Conditional format looks for files which have not changed since they
|
||||
were created. Here the condition value is "=C2". The = sign means C2 is treated
|
||||
as a formula, not literal text. Unlike the file age, we want the cell used to
|
||||
change for each cell where the conditional format applies. The first cell in
|
||||
the conditional format range is D2, which is compared against C2, then D3 is
|
||||
compared against C3 and so on. A common mistake is to include the title row in
|
||||
the range and accidentally apply conditional formatting to it, or to begin the
|
||||
range at row 2 but use row 1 as the starting point for comparisons.
|
||||
.Example
|
||||
Add-ConditionalFormatting $ws.Cells["B:B"] GreaterThan 10000000 -Fore Red -Stop -Pri 1
|
||||
|
||||
This version shows the shortest syntax - the Address, Ruletype, and
|
||||
Conditionvalue can be identified from their position, and ForegroundColor,
|
||||
StopIfTrue and Priority can all be shortend.
|
||||
|
||||
In this example a named range is used to select the cells where the formula should apply. If a cell in the "FinishPosition" range is 1, then the text is turned to Bold & Purple.
|
||||
This rule is moved to first in the priority list, and where cells have a value of 1, no other rules will be processed.
|
||||
#>
|
||||
Param (
|
||||
#A block of cells to format - you can use a named range with -Address $ws.names[1] or $ws.cells["RangeName"]
|
||||
@@ -52,14 +103,14 @@
|
||||
#A standard named-rule - Top / Bottom / Less than / Greater than / Contains etc.
|
||||
[Parameter(Mandatory = $true, ParameterSetName = "NamedRule", Position = 1)]
|
||||
[OfficeOpenXml.ConditionalFormatting.eExcelConditionalFormattingRuleType]$RuleType ,
|
||||
#Text colour for matching objects
|
||||
#Text color for matching objects
|
||||
[Parameter(ParameterSetName = "NamedRule")]
|
||||
[Alias("ForeGroundColour")]
|
||||
[System.Drawing.Color]$ForeGroundColor,
|
||||
#Colour for databar type charts
|
||||
[Alias("ForegroundColour")]
|
||||
$ForegroundColor,
|
||||
#Color for databar type charts
|
||||
[Parameter(Mandatory = $true, ParameterSetName = "DataBar")]
|
||||
[Alias("DataBarColour")]
|
||||
[System.Drawing.Color]$DataBarColor,
|
||||
$DataBarColor,
|
||||
#One of the three-icon set types (e.g. Traffic Lights)
|
||||
[Parameter(Mandatory = $true, ParameterSetName = "ThreeIconSet")]
|
||||
[OfficeOpenXml.ConditionalFormatting.eExcelconditionalFormatting3IconsSetType]$ThreeIconsSet,
|
||||
@@ -69,27 +120,27 @@
|
||||
#A five-icon set name
|
||||
[Parameter(Mandatory = $true, ParameterSetName = "FiveIconSet")]
|
||||
[OfficeOpenXml.ConditionalFormatting.eExcelconditionalFormatting5IconsSetType]$FiveIconsSet,
|
||||
#Use the icon set in reverse order, or reverse the orders of Two- & Three-Color Scales
|
||||
#Use the Icon-Set in reverse order, or reverse the orders of Two- & Three-Color Scales
|
||||
[Parameter(ParameterSetName = "NamedRule")]
|
||||
[Parameter(ParameterSetName = "ThreeIconSet")]
|
||||
[Parameter(ParameterSetName = "FourIconSet")]
|
||||
[Parameter(ParameterSetName = "FiveIconSet")]
|
||||
[switch]$Reverse,
|
||||
#A value for the condition (for example 2000 if the test is 'lessthan 2000'; Formulas should begin with "=" )
|
||||
[Parameter(ParameterSetName = "NamedRule")]
|
||||
[Parameter(ParameterSetName = "NamedRule",Position = 2)]
|
||||
$ConditionValue,
|
||||
#A second value for the conditions like "between x and Y"
|
||||
[Parameter(ParameterSetName = "NamedRule")]
|
||||
#A second value for the conditions like "Between X and Y"
|
||||
[Parameter(ParameterSetName = "NamedRule",Position = 3)]
|
||||
$ConditionValue2,
|
||||
#Background colour for matching items
|
||||
#Background color for matching items
|
||||
[Parameter(ParameterSetName = "NamedRule")]
|
||||
[System.Drawing.Color]$BackgroundColor,
|
||||
$BackgroundColor,
|
||||
#Background pattern for matching items
|
||||
[Parameter(ParameterSetName = "NamedRule")]
|
||||
[OfficeOpenXml.Style.ExcelFillStyle]$BackgroundPattern = [OfficeOpenXml.Style.ExcelFillStyle]::None ,
|
||||
#Secondary colour when a background pattern requires it
|
||||
#Secondary color when a background pattern requires it
|
||||
[Parameter(ParameterSetName = "NamedRule")]
|
||||
[System.Drawing.Color]$PatternColor,
|
||||
$PatternColor,
|
||||
#Sets the numeric format for matching items
|
||||
[Parameter(ParameterSetName = "NamedRule")]
|
||||
$NumberFormat,
|
||||
@@ -111,7 +162,7 @@
|
||||
#Set the sequence for rule processing
|
||||
[int]$Priority,
|
||||
#If specified pass the rule back to the caller to allow additional customization.
|
||||
[switch]$Passthru
|
||||
[switch]$PassThru
|
||||
)
|
||||
|
||||
#Allow conditional formatting to work like Set-ExcelRange (with single ADDRESS parameter), split it to get worksheet and range of cells.
|
||||
@@ -141,11 +192,13 @@
|
||||
#By this point we should have a worksheet object whose ConditionalFormatting collection we will add to. If not, bail.
|
||||
if (-not $worksheet -or $WorkSheet -isnot [OfficeOpenXml.ExcelWorksheet]) {write-warning "You need to provide a worksheet object." ; return}
|
||||
#region create a rule of the right type
|
||||
if ($RuleType -match 'IconSet$') {Write-warning -Message "You cannot configure a IconSet rule in this way; please use -$RuleType <SetName>." ; return}
|
||||
if ($PSBoundParameters.ContainsKey("ThreeIconsSet" ) ) {$rule = $WorkSheet.ConditionalFormatting.AddThreeIconSet($Address , $ThreeIconsSet)}
|
||||
if ($RuleType -match 'IconSet$') {Write-warning -Message "You cannot configure a Icon-Set rule in this way; please use -$RuleType <SetName>." ; return}
|
||||
if ($PSBoundParameters.ContainsKey("DataBarColor" ) ) {if ($DataBarColor -is [string]) {$DataBarColor = [System.Drawing.Color]::$DataBarColor }
|
||||
$rule = $WorkSheet.ConditionalFormatting.AddDatabar( $Address , $DataBarColor )
|
||||
}
|
||||
elseif ($PSBoundParameters.ContainsKey("ThreeIconsSet" ) ) {$rule = $WorkSheet.ConditionalFormatting.AddThreeIconSet($Address , $ThreeIconsSet)}
|
||||
elseif ($PSBoundParameters.ContainsKey("FourIconsSet" ) ) {$rule = $WorkSheet.ConditionalFormatting.AddFourIconSet( $Address , $FourIconsSet )}
|
||||
elseif ($PSBoundParameters.ContainsKey("FiveIconsSet" ) ) {$rule = $WorkSheet.ConditionalFormatting.AddFiveIconSet( $Address , $FiveIconsSet )}
|
||||
elseif ($PSBoundParameters.ContainsKey("DataBarColor" ) ) {$rule = $WorkSheet.ConditionalFormatting.AddDatabar( $Address , $DataBarColor )}
|
||||
else {$rule = ($WorkSheet.ConditionalFormatting)."Add$RuleType"($Address ) }
|
||||
if ($Reverse) {
|
||||
if ($rule.type -match 'IconSet$' ) {$rule.reverse = $true}
|
||||
@@ -156,7 +209,7 @@
|
||||
#region set the rule conditions
|
||||
#for lessThan/GreaterThan/Equal/Between conditions make sure that strings are wrapped in quotes. Formulas should be passed with = which will be stripped.
|
||||
if ($RuleType -match "Than|Equal|Between" ) {
|
||||
if ($ConditionValue) {
|
||||
if ($PSBoundParameters.ContainsKey("ConditionValue" )) {
|
||||
$number = $Null
|
||||
#if the condition type is not a value type, but parses as a number, make it the number
|
||||
if ($ConditionValue -isnot [System.ValueType] -and [Double]::TryParse($ConditionValue, [System.Globalization.NumberStyles]::Any, [System.Globalization.NumberFormatInfo]::CurrentInfo, [Ref]$number) ) {
|
||||
@@ -166,7 +219,7 @@
|
||||
$ConditionValue = '"' + $ConditionValue +'"'
|
||||
}
|
||||
}
|
||||
if ($ConditionValue2) {
|
||||
if ($PSBoundParameters.ContainsKey("ConditionValue2")) {
|
||||
$number = $Null
|
||||
if ($ConditionValue -isnot [System.ValueType] -and [Double]::TryParse($ConditionValue2, [System.Globalization.NumberStyles]::Any, [System.Globalization.NumberFormatInfo]::CurrentInfo, [Ref]$number) ) {
|
||||
$ConditionValue2 = $number
|
||||
@@ -204,10 +257,13 @@
|
||||
if ($PSBoundParameters.ContainsKey("Bold" ) ) {$rule.Style.Font.Bold = [boolean]$Bold }
|
||||
if ($PSBoundParameters.ContainsKey("Italic" ) ) {$rule.Style.Font.Italic = [boolean]$Italic }
|
||||
if ($PSBoundParameters.ContainsKey("StrikeThru" ) ) {$rule.Style.Font.Strike = [boolean]$StrikeThru }
|
||||
if ($PSBoundParameters.ContainsKey("ForeGroundColor" ) ) {$rule.Style.Font.Color.color = $ForeGroundColor }
|
||||
if ($PSBoundParameters.ContainsKey("BackgroundColor" ) ) {$rule.Style.Fill.BackgroundColor.color = $BackgroundColor }
|
||||
if ($PSBoundParameters.ContainsKey("ForeGroundColor" ) ) {if ($ForeGroundColor -is [string]) {$ForeGroundColor = [System.Drawing.Color]::$ForeGroundColor }
|
||||
$rule.Style.Font.Color.color = $ForeGroundColor }
|
||||
if ($PSBoundParameters.ContainsKey("BackgroundColor" ) ) {if ($BackgroundColor -is [string]) {$BackgroundColor = [System.Drawing.Color]::$BackgroundColor }
|
||||
$rule.Style.Fill.BackgroundColor.color = $BackgroundColor }
|
||||
if ($PSBoundParameters.ContainsKey("BackgroundPattern") ) {$rule.Style.Fill.PatternType = $BackgroundPattern }
|
||||
if ($PSBoundParameters.ContainsKey("PatternColor" ) ) {$rule.Style.Fill.PatternColor.color = $PatternColor }
|
||||
if ($PSBoundParameters.ContainsKey("PatternColor" ) ) {if ($PatternColor -is [string]) {$PatternColor = [System.Drawing.Color]::$PatternColor }
|
||||
$rule.Style.Fill.PatternColor.color = $PatternColor }
|
||||
#endregion
|
||||
#Allow further tweaking by returning the rule, if passthru specified
|
||||
if ($Passthru) {$rule}
|
||||
|
||||
@@ -1,18 +1,21 @@
|
||||
Function ConvertTo-ExcelXlsx {
|
||||
[CmdletBinding()]
|
||||
<#
|
||||
.SYNOPSIS
|
||||
Converts an Excel xls to a xlsx using -ComObject
|
||||
#>
|
||||
[CmdletBinding()]
|
||||
Param
|
||||
(
|
||||
[parameter(Mandatory=$true, ValueFromPipeline)]
|
||||
[parameter(Mandatory = $true, ValueFromPipeline)]
|
||||
[string]$Path,
|
||||
[parameter(Mandatory=$false)]
|
||||
[parameter(Mandatory = $false)]
|
||||
[switch]$Force
|
||||
)
|
||||
Process
|
||||
{
|
||||
if(-Not ($Path | Test-Path) ){
|
||||
throw "File not found"
|
||||
Process {
|
||||
if (-Not ($Path | Test-Path) ) {
|
||||
throw "File not found"
|
||||
}
|
||||
if(-Not ($Path | Test-Path -PathType Leaf) ){
|
||||
if (-Not ($Path | Test-Path -PathType Leaf) ) {
|
||||
throw "Folder paths are not allowed"
|
||||
}
|
||||
|
||||
@@ -20,26 +23,29 @@ Function ConvertTo-ExcelXlsx {
|
||||
$xlsFile = Get-Item -Path $Path
|
||||
$xlsxPath = "{0}x" -f $xlsFile.FullName
|
||||
|
||||
if($xlsFile.Extension -ne ".xls"){
|
||||
if ($xlsFile.Extension -ne ".xls") {
|
||||
throw "Expected .xls extension"
|
||||
}
|
||||
|
||||
if(Test-Path -Path $xlsxPath){
|
||||
if($Force){
|
||||
if (Test-Path -Path $xlsxPath) {
|
||||
if ($Force) {
|
||||
try {
|
||||
Remove-Item $xlsxPath -Force
|
||||
} catch {
|
||||
}
|
||||
catch {
|
||||
throw "{0} already exists and cannot be removed. The file may be locked by another application." -f $xlsxPath
|
||||
}
|
||||
Write-Verbose $("Removed {0}" -f $xlsxPath)
|
||||
} else {
|
||||
}
|
||||
else {
|
||||
throw "{0} already exists!" -f $xlsxPath
|
||||
}
|
||||
}
|
||||
|
||||
try{
|
||||
try {
|
||||
$Excel = New-Object -ComObject "Excel.Application"
|
||||
} catch {
|
||||
}
|
||||
catch {
|
||||
throw "Could not create Excel.Application ComObject. Please verify that Excel is installed."
|
||||
}
|
||||
|
||||
|
||||
12
DoTests.ps1
12
DoTests.ps1
@@ -1,3 +1,7 @@
|
||||
param(
|
||||
[Switch]$DontCreateZip
|
||||
)
|
||||
|
||||
##
|
||||
# Used in Appveyor.yml
|
||||
##
|
||||
@@ -8,10 +12,12 @@ $PSVersionTable.PSVersion
|
||||
## Otherwise the EPPlus.dll is in use after the Pester run
|
||||
$ModuleVersion = (Get-Content -Raw .\ImportExcel.psd1) | Invoke-Expression | ForEach-Object ModuleVersion
|
||||
|
||||
$dest = "ImportExcel-{0}-{1}.zip" -f $ModuleVersion, (Get-Date).ToString("yyyyMMddHHmmss")
|
||||
Compress-Archive -Path . -DestinationPath .\$dest
|
||||
if (!$DontCreateZip) {
|
||||
$dest = "ImportExcel-{0}-{1}.zip" -f $ModuleVersion, (Get-Date).ToString("yyyyMMddHHmmss")
|
||||
Compress-Archive -Path . -DestinationPath .\$dest
|
||||
}
|
||||
|
||||
if ((Get-Module -ListAvailable pester) -eq $null) {
|
||||
if ($null -eq (Get-Module -ListAvailable pester)) {
|
||||
Install-Module -Name Pester -Repository PSGallery -Force -Scope CurrentUser
|
||||
}
|
||||
|
||||
|
||||
15
Examples/AddWorkSheet/AddMultiWorkSheet.ps1
Normal file
15
Examples/AddWorkSheet/AddMultiWorkSheet.ps1
Normal file
@@ -0,0 +1,15 @@
|
||||
try {. $PSScriptRoot\..\..\LoadPSD1.ps1} catch {}
|
||||
|
||||
$xlSourcefile = "$env:TEMP\Source.xlsx"
|
||||
write-host "Save location: $xlSourcefile"
|
||||
|
||||
Remove-Item $xlSourcefile -ErrorAction Ignore
|
||||
|
||||
#Put some simple data in a worksheet and Get an excel package object to represent the file
|
||||
$TabData1 = 1..5 | Export-Excel $xlSourcefile -WorksheetName 'Tab 1' -AutoSize -AutoFilter
|
||||
|
||||
#Add another tab. Replace the $TabData2 with your data
|
||||
$TabData2 = 1..10 | Export-Excel $xlSourcefile -WorksheetName 'Tab 2' -AutoSize -AutoFilter
|
||||
|
||||
#Add another tab. Replace the $TabData3 with your data
|
||||
$TabData3 = 1..15 | Export-Excel $xlSourcefile -WorksheetName 'Tab 3' -AutoSize -AutoFilter -Show
|
||||
@@ -51,7 +51,7 @@ Set-Format -Address $sheet1.Cells["E2:G2"] -BorderBottom $BorderBottom -BorderCo
|
||||
Set-Format -Address $sheet1.Cells["I2:K2"] -BorderBottom $BorderBottom -BorderColor $BorderColor
|
||||
Set-Format -Address $sheet1.Cells["M2:O2"] -BorderBottom $BorderBottom -BorderColor $BorderColor
|
||||
|
||||
Set-Format -Address $sheet1.Cells["A2:C8"] -FontColor GrayText
|
||||
Set-Format -Address $sheet1.Cells["A2:C8"] -FontColor Gray
|
||||
|
||||
$HorizontalAlignment = "Center"
|
||||
Set-Format -Address $sheet1.Cells["F1"] -HorizontalAlignment $HorizontalAlignment -Bold -Value Revenue
|
||||
|
||||
24
Examples/FormatCellStyles/ApplyStyle.ps1
Normal file
24
Examples/FormatCellStyles/ApplyStyle.ps1
Normal file
@@ -0,0 +1,24 @@
|
||||
$data = ConvertFrom-Csv @'
|
||||
Item,Quantity,Price,Total Cost
|
||||
Footballs,9,21.95,197.55
|
||||
Cones,36,7.99,287.64
|
||||
Shin Guards,14,10.95,153.3
|
||||
Turf Shoes,22,79.95,1758.9
|
||||
Baseballs,68,7.99,543.32
|
||||
Baseball Gloves,31,65.00,2015.00
|
||||
Baseball Bats,38,159.00,6042.00
|
||||
'@
|
||||
|
||||
$f = "$env:TEMP\styles.xlsx"
|
||||
Remove-Item $f -ErrorAction SilentlyContinue
|
||||
|
||||
$pkg = $data | Export-Excel -Path $f -AutoSize -PassThru
|
||||
|
||||
$ws = $pkg.Workbook.Worksheets["Sheet1"]
|
||||
|
||||
Set-ExcelRange -WorkSheet $ws -Range "A2:C6" -BackgroundColor PeachPuff -FontColor Purple -FontSize 12 -Width 12
|
||||
Set-ExcelRange -WorkSheet $ws -Range "D2:D6" -BackgroundColor WhiteSmoke -FontColor Orange -Bold -FontSize 12 -Width 12
|
||||
Set-ExcelRange -WorkSheet $ws -Range "A1:D1" -BackgroundColor BlueViolet -FontColor Wheat -FontSize 12 -Width 12
|
||||
Set-ExcelRange -WorkSheet $ws -Range "A:A" -Width 15
|
||||
|
||||
Close-ExcelPackage -ExcelPackage $pkg -Show
|
||||
101
Examples/Grouping/First10Races.csv
Normal file
101
Examples/Grouping/First10Races.csv
Normal file
@@ -0,0 +1,101 @@
|
||||
Race,Date,FinishPosition,Driver,GridPosition,Team,Points
|
||||
Australian,25/03/2018,1,Sebastian Vettel,3,Ferrari,25
|
||||
Australian,25/03/2018,2,Lewis Hamilton,1,Mercedes,18
|
||||
Australian,25/03/2018,3,Kimi Räikkönen,2,Ferrari,15
|
||||
Australian,25/03/2018,4,Daniel Ricciardo,8,Red Bull Racing-TAG Heuer,12
|
||||
Australian,25/03/2018,5,Fernando Alonso,10,McLaren-Renault,10
|
||||
Australian,25/03/2018,6,Max Verstappen,4,Red Bull Racing-TAG Heuer,8
|
||||
Australian,25/03/2018,7,Nico Hülkenberg,7,Renault,6
|
||||
Australian,25/03/2018,8,Valtteri Bottas,15,Mercedes,4
|
||||
Australian,25/03/2018,9,Stoffel Vandoorne,11,McLaren-Renault,2
|
||||
Australian,25/03/2018,10,Carlos Sainz,9,Renault,1
|
||||
Bahrain,08/04/2018,1,Sebastian Vettel,1,Ferrari,25
|
||||
Bahrain,08/04/2018,2,Valtteri Bottas,3,Mercedes,18
|
||||
Bahrain,08/04/2018,3,Lewis Hamilton,9,Mercedes,15
|
||||
Bahrain,08/04/2018,4,Pierre Gasly,5,STR-Honda,12
|
||||
Bahrain,08/04/2018,5,Kevin Magnussen,6,Haas-Ferrari,10
|
||||
Bahrain,08/04/2018,6,Nico Hülkenberg,7,Renault,8
|
||||
Bahrain,08/04/2018,7,Fernando Alonso,13,McLaren-Renault,6
|
||||
Bahrain,08/04/2018,8,Stoffel Vandoorne,14,McLaren-Renault,4
|
||||
Bahrain,08/04/2018,9,Marcus Ericsson,17,Sauber-Ferrari,2
|
||||
Bahrain,08/04/2018,10,Esteban Ocon,8,Force India-Mercedes,1
|
||||
Chinese,15/04/2018,1,Daniel Ricciardo,6,Red Bull Racing-TAG Heuer,25
|
||||
Chinese,15/04/2018,2,Valtteri Bottas,3,Mercedes,18
|
||||
Chinese,15/04/2018,3,Kimi Räikkönen,2,Ferrari,15
|
||||
Chinese,15/04/2018,4,Lewis Hamilton,4,Mercedes,12
|
||||
Chinese,15/04/2018,5,Max Verstappen,5,Red Bull Racing-TAG Heuer,10
|
||||
Chinese,15/04/2018,6,Nico Hülkenberg,7,Renault,8
|
||||
Chinese,15/04/2018,7,Fernando Alonso,13,McLaren-Renault,6
|
||||
Chinese,15/04/2018,8,Sebastian Vettel,1,Ferrari,4
|
||||
Chinese,15/04/2018,9,Carlos Sainz,9,Renault,2
|
||||
Chinese,15/04/2018,10,Kevin Magnussen,11,Haas-Ferrari,1
|
||||
Azerbaijan,29/04/2018,1,Lewis Hamilton,2,Mercedes,25
|
||||
Azerbaijan,29/04/2018,2,Kimi Räikkönen,6,Ferrari,18
|
||||
Azerbaijan,29/04/2018,3,Sergio Pérez,8,Force India-Mercedes,15
|
||||
Azerbaijan,29/04/2018,4,Sebastian Vettel,1,Ferrari,12
|
||||
Azerbaijan,29/04/2018,5,Carlos Sainz,9,Renault,10
|
||||
Azerbaijan,29/04/2018,6,Charles Leclerc,13,Sauber-Ferrari,8
|
||||
Azerbaijan,29/04/2018,7,Fernando Alonso,12,McLaren-Renault,6
|
||||
Azerbaijan,29/04/2018,8,Lance Stroll,10,Williams-Mercedes,4
|
||||
Azerbaijan,29/04/2018,9,Stoffel Vandoorne,16,McLaren-Renault,2
|
||||
Azerbaijan,29/04/2018,10,Brendon Hartley,19,STR-Honda,1
|
||||
Spanish,13/05/2018,1,Lewis Hamilton,1,Mercedes,25
|
||||
Spanish,13/05/2018,2,Valtteri Bottas,2,Mercedes,18
|
||||
Spanish,13/05/2018,3,Max Verstappen,5,Red Bull Racing-TAG Heuer,15
|
||||
Spanish,13/05/2018,4,Sebastian Vettel,3,Ferrari,12
|
||||
Spanish,13/05/2018,5,Daniel Ricciardo,6,Red Bull Racing-TAG Heuer,10
|
||||
Spanish,13/05/2018,6,Kevin Magnussen,7,Haas-Ferrari,8
|
||||
Spanish,13/05/2018,7,Carlos Sainz,9,Renault,6
|
||||
Spanish,13/05/2018,8,Fernando Alonso,8,McLaren-Renault,4
|
||||
Spanish,13/05/2018,9,Sergio Pérez,15,Force India-Mercedes,2
|
||||
Spanish,13/05/2018,10,Charles Leclerc,14,Sauber-Ferrari,1
|
||||
Monaco,27/05/2018,1,Daniel Ricciardo,1,Red Bull Racing-TAG Heuer,25
|
||||
Monaco,27/05/2018,2,Sebastian Vettel,2,Ferrari,18
|
||||
Monaco,27/05/2018,3,Lewis Hamilton,3,Mercedes,15
|
||||
Monaco,27/05/2018,4,Kimi Räikkönen,4,Ferrari,12
|
||||
Monaco,27/05/2018,5,Valtteri Bottas,5,Mercedes,10
|
||||
Monaco,27/05/2018,6,Esteban Ocon,6,Force India-Mercedes,8
|
||||
Monaco,27/05/2018,7,Pierre Gasly,10,STR-Honda,6
|
||||
Monaco,27/05/2018,8,Nico Hülkenberg,11,Renault,4
|
||||
Monaco,27/05/2018,9,Max Verstappen,20,Red Bull Racing-TAG Heuer,2
|
||||
Monaco,27/05/2018,10,Carlos Sainz,8,Renault,1
|
||||
Canadian,10/06/2018,1,Sebastian Vettel,1,Ferrari,25
|
||||
Canadian,10/06/2018,2,Valtteri Bottas,2,Mercedes,18
|
||||
Canadian,10/06/2018,3,Max Verstappen,3,Red Bull Racing-TAG Heuer,15
|
||||
Canadian,10/06/2018,4,Daniel Ricciardo,6,Red Bull Racing-TAG Heuer,12
|
||||
Canadian,10/06/2018,5,Lewis Hamilton,4,Mercedes,10
|
||||
Canadian,10/06/2018,6,Kimi Räikkönen,5,Ferrari,8
|
||||
Canadian,10/06/2018,7,Nico Hülkenberg,7,Renault,6
|
||||
Canadian,10/06/2018,8,Carlos Sainz,9,Renault,4
|
||||
Canadian,10/06/2018,9,Esteban Ocon,8,Force India-Mercedes,2
|
||||
Canadian,10/06/2018,10,Charles Leclerc,13,Sauber-Ferrari,1
|
||||
French,24/06/2018,1,Lewis Hamilton,1,Mercedes,25
|
||||
French,24/06/2018,2,Max Verstappen,4,Red Bull Racing-TAG Heuer,18
|
||||
French,24/06/2018,3,Kimi Räikkönen,6,Ferrari,15
|
||||
French,24/06/2018,4,Daniel Ricciardo,5,Red Bull Racing-TAG Heuer,12
|
||||
French,24/06/2018,5,Sebastian Vettel,3,Ferrari,10
|
||||
French,24/06/2018,6,Kevin Magnussen,9,Haas-Ferrari,8
|
||||
French,24/06/2018,7,Valtteri Bottas,2,Mercedes,6
|
||||
French,24/06/2018,8,Carlos Sainz,7,Renault,4
|
||||
French,24/06/2018,9,Nico Hülkenberg,12,Renault,2
|
||||
French,24/06/2018,10,Charles Leclerc,8,Sauber-Ferrari,1
|
||||
Austrian,01/07/2018,1,Max Verstappen,4,Red Bull Racing-TAG Heuer,25
|
||||
Austrian,01/07/2018,2,Kimi Räikkönen,3,Ferrari,18
|
||||
Austrian,01/07/2018,3,Sebastian Vettel,6,Ferrari,15
|
||||
Austrian,01/07/2018,4,Romain Grosjean,5,Haas-Ferrari,12
|
||||
Austrian,01/07/2018,5,Kevin Magnussen,8,Haas-Ferrari,10
|
||||
Austrian,01/07/2018,6,Esteban Ocon,11,Force India-Mercedes,8
|
||||
Austrian,01/07/2018,7,Sergio Pérez,15,Force India-Mercedes,6
|
||||
Austrian,01/07/2018,8,Fernando Alonso,20,McLaren-Renault,4
|
||||
Austrian,01/07/2018,9,Charles Leclerc,17,Sauber-Ferrari,2
|
||||
Austrian,01/07/2018,10,Marcus Ericsson,18,Sauber-Ferrari,1
|
||||
British,08/07/2018,1,Sebastian Vettel,2,Ferrari,25
|
||||
British,08/07/2018,2,Lewis Hamilton,1,Mercedes,18
|
||||
British,08/07/2018,3,Kimi Räikkönen,3,Ferrari,15
|
||||
British,08/07/2018,4,Valtteri Bottas,4,Mercedes,12
|
||||
British,08/07/2018,5,Daniel Ricciardo,6,Red Bull Racing-TAG Heuer,10
|
||||
British,08/07/2018,6,Nico Hülkenberg,11,Renault,8
|
||||
British,08/07/2018,7,Esteban Ocon,10,Force India-Mercedes,6
|
||||
British,08/07/2018,8,Fernando Alonso,13,McLaren-Renault,4
|
||||
British,08/07/2018,9,Kevin Magnussen,7,Haas-Ferrari,2
|
||||
British,08/07/2018,10,Sergio Pérez,12,Force India-Mercedes,1
|
||||
|
10
Examples/Grouping/GroupDate.ps1
Normal file
10
Examples/Grouping/GroupDate.ps1
Normal file
@@ -0,0 +1,10 @@
|
||||
$xlfile = "$env:TEMP\Points.xlsx"
|
||||
|
||||
Remove-Item $xlfile -ErrorAction SilentlyContinue
|
||||
|
||||
$PivotTableDefinition = New-PivotTableDefinition -Activate -PivotTableName Points `
|
||||
-PivotRows Driver, Date -PivotData @{Points = "SUM"} -GroupDateRow Date -GroupDatePart Years, Months
|
||||
|
||||
Import-Csv "$PSScriptRoot\First10Races.csv" |
|
||||
Select-Object Race, @{n = "Date"; e = {[datetime]::ParseExact($_.date, "dd/MM/yyyy", (Get-Culture))}}, FinishPosition, Driver, GridPosition, Team, Points |
|
||||
Export-Excel $xlfile -Show -AutoSize -PivotTableDefinition $PivotTableDefinition
|
||||
10
Examples/Grouping/GroupNumeric.ps1
Normal file
10
Examples/Grouping/GroupNumeric.ps1
Normal file
@@ -0,0 +1,10 @@
|
||||
$xlfile = "$env:TEMP\Places.xlsx"
|
||||
|
||||
Remove-Item $xlfile -ErrorAction SilentlyContinue
|
||||
|
||||
$PivotTableDefinition = New-PivotTableDefinition -Activate -PivotTableName Places `
|
||||
-PivotRows Driver, FinishPosition -PivotData @{Date = "Count"} -GroupNumericRow FinishPosition -GroupNumericMin 1 -GroupNumericMax 25 -GroupNumericInterval 3
|
||||
|
||||
Import-Csv "$PSScriptRoot\First10Races.csv" |
|
||||
Select-Object Race, @{n = "Date"; e = {[datetime]::ParseExact($_.date, "dd/MM/yyyy", (Get-Culture))}}, FinishPosition, Driver, GridPosition, Team, Points |
|
||||
Export-Excel $xlfile -Show -AutoSize -PivotTableDefinition $PivotTableDefinition
|
||||
39
Examples/Grouping/TimestampBucket.ps1
Normal file
39
Examples/Grouping/TimestampBucket.ps1
Normal file
@@ -0,0 +1,39 @@
|
||||
$data = ConvertFrom-Csv @"
|
||||
Timestamp,Tenant
|
||||
10/29/2018 3:00:00.123,1
|
||||
10/29/2018 3:00:10.456,1
|
||||
10/29/2018 3:01:20.389,1
|
||||
10/29/2018 3:00:30.222,1
|
||||
10/29/2018 3:00:40.143,1
|
||||
10/29/2018 3:00:50.809,1
|
||||
10/29/2018 3:01:00.193,1
|
||||
10/29/2018 3:01:10.555,1
|
||||
10/29/2018 3:01:20.739,1
|
||||
10/29/2018 3:01:30.912,1
|
||||
10/29/2018 3:01:40.989,1
|
||||
10/29/2018 3:01:50.545,1
|
||||
10/29/2018 3:02:00.999,1
|
||||
"@ | Select-Object @{n = 'Timestamp'; e = {get-date $_.timestamp}}, tenant, @{n = 'Bucket'; e = { - (get-date $_.timestamp).Second % 30}}
|
||||
|
||||
$f = "$env:temp\pivottest.xlsx"
|
||||
Remove-Item $f -ErrorAction SilentlyContinue
|
||||
|
||||
$pivotDefParams = @{
|
||||
PivotTableName = 'Timestamp Buckets'
|
||||
PivotRows = @('Timestamp', 'Tenant')
|
||||
PivotData = @{'Bucket' = 'count'}
|
||||
GroupDateRow = 'TimeStamp'
|
||||
GroupDatePart = @('Hours', 'Minutes')
|
||||
Activate = $true
|
||||
}
|
||||
|
||||
$excelParams = @{
|
||||
PivotTableDefinition = New-PivotTableDefinition @pivotDefParams
|
||||
Path = $f
|
||||
WorkSheetname = "Log Data"
|
||||
AutoSize = $true
|
||||
AutoFilter = $true
|
||||
Show = $true
|
||||
}
|
||||
|
||||
$data | Export-Excel @excelParams
|
||||
55
Examples/MortgageCalculator/MortgageCalculator.ps1
Normal file
55
Examples/MortgageCalculator/MortgageCalculator.ps1
Normal file
@@ -0,0 +1,55 @@
|
||||
<#
|
||||
Fixed Rate Loan/Mortgage Calculator in Excel
|
||||
#>
|
||||
|
||||
param(
|
||||
$Amount = 400000,
|
||||
$InterestRate = .065,
|
||||
$Term = 30
|
||||
)
|
||||
|
||||
function New-CellData {
|
||||
param(
|
||||
$Range,
|
||||
$Value,
|
||||
$Format
|
||||
)
|
||||
|
||||
$setFormatParams = @{
|
||||
WorkSheet = $ws
|
||||
Range = $Range
|
||||
NumberFormat = $Format
|
||||
}
|
||||
|
||||
if ($Value -is [string] -and $Value.StartsWith('=')) {
|
||||
$setFormatParams.Formula = $Value
|
||||
}
|
||||
else {
|
||||
$setFormatParams.Value = $Value
|
||||
}
|
||||
|
||||
Set-Format @setFormatParams
|
||||
}
|
||||
|
||||
$f = "$PSScriptRoot\mortgage.xlsx"
|
||||
Remove-Item $f -ErrorAction SilentlyContinue
|
||||
|
||||
$pkg = "" | Export-Excel $f -Title 'Fixed Rate Loan Payments' -PassThru -AutoSize
|
||||
$ws = $pkg.Workbook.Worksheets["Sheet1"]
|
||||
|
||||
New-CellData A3 'Amount'
|
||||
New-CellData B3 $Amount '$#,##0'
|
||||
|
||||
New-CellData A4 "Interest Rate"
|
||||
New-CellData B4 $InterestRate 'Percentage'
|
||||
|
||||
New-CellData A5 "Term (Years)"
|
||||
New-CellData B5 $Term
|
||||
|
||||
New-CellData D3 "Monthly Payment"
|
||||
New-CellData F3 "=-PMT(F4, B5*12, B3)" '$#,##0.#0'
|
||||
|
||||
New-CellData D4 "Monthly Rate"
|
||||
New-CellData F4 "=((1+B4)^(1/12))-1" 'Percentage'
|
||||
|
||||
Close-ExcelPackage $pkg -Show
|
||||
55
Examples/PivotTable/MultiplePivotTables.ps1
Normal file
55
Examples/PivotTable/MultiplePivotTables.ps1
Normal file
@@ -0,0 +1,55 @@
|
||||
$data = ConvertFrom-Csv @"
|
||||
Region,Date,Fruit,Sold
|
||||
North,1/1/2017,Pears,50
|
||||
South,1/1/2017,Pears,150
|
||||
East,4/1/2017,Grapes,100
|
||||
West,7/1/2017,Bananas,150
|
||||
South,10/1/2017,Apples,200
|
||||
North,1/1/2018,Pears,100
|
||||
East,4/1/2018,Grapes,200
|
||||
West,7/1/2018,Bananas,300
|
||||
South,10/1/2018,Apples,400
|
||||
"@ | Select-Object -Property Region, @{n = "Date"; e = {[datetime]::ParseExact($_.Date, "M/d/yyyy", (Get-Culture))}}, Fruit, Sold
|
||||
|
||||
$xlfile = "$env:temp\multiplePivotTables.xlsx"
|
||||
Remove-Item $xlfile -ErrorAction SilentlyContinue
|
||||
|
||||
$excel = $data | Export-Excel $xlfile -PassThru -AutoSize -TableName FruitData
|
||||
|
||||
$pivotTableParams = @{
|
||||
PivotTableName = "ByRegion"
|
||||
Address = $excel.Sheet1.cells["F1"]
|
||||
SourceWorkSheet = $excel.Sheet1
|
||||
PivotRows = echo Region Fruit Date
|
||||
PivotData = @{'sold' = 'sum'}
|
||||
PivotTableStyle = 'Light21'
|
||||
GroupDateRow = "Date"
|
||||
GroupDatePart = echo Years Quarters
|
||||
}
|
||||
|
||||
$pt = Add-PivotTable @pivotTableParams -PassThru
|
||||
#$pt.RowHeaderCaption ="By Region,Fruit,Date"
|
||||
$pt.RowHeaderCaption = "By " + ($pivotTableParams.PivotRows -join ",")
|
||||
|
||||
$pivotTableParams.PivotTableName = "ByFruit"
|
||||
$pivotTableParams.Address = $excel.Sheet1.cells["J1"]
|
||||
$pivotTableParams.PivotRows = echo Fruit Region Date
|
||||
|
||||
$pt = Add-PivotTable @pivotTableParams -PassThru
|
||||
$pt.RowHeaderCaption = "By Fruit,Region"
|
||||
|
||||
$pivotTableParams.PivotTableName = "ByDate"
|
||||
$pivotTableParams.Address = $excel.Sheet1.cells["N1"]
|
||||
$pivotTableParams.PivotRows = echo Date Region Fruit
|
||||
|
||||
$pt = Add-PivotTable @pivotTableParams -PassThru
|
||||
$pt.RowHeaderCaption = "By Date,Region,Fruit"
|
||||
|
||||
$pivotTableParams.PivotTableName = "ByYears"
|
||||
$pivotTableParams.Address = $excel.Sheet1.cells["S1"]
|
||||
$pivotTableParams.GroupDatePart = echo Years
|
||||
|
||||
$pt = Add-PivotTable @pivotTableParams -PassThru
|
||||
$pt.RowHeaderCaption = "By Years,Region"
|
||||
|
||||
Close-ExcelPackage $excel -Show
|
||||
@@ -15,7 +15,7 @@ Apple, New York, 1200,700
|
||||
#Add a pivot table, specify its address to put it on the same sheet, use the data that was just exported set the table style and number format.
|
||||
#Use the "City" for the row names, and "Product" for the columnnames, and sum both the gross and net values for each City/Product combination; add grand totals to rows and columns.
|
||||
# activate the sheet and add a pivot chart (defined in a hash table)
|
||||
Add-PivotTable -Address $excel.Sheet1.Cells["F1"] -SourceWorkSheet $Excel.Sheet1 -SourceRange $Excel.Sheet1.Dimension.Address -PivotTableName "Sales" -PivotTableSyle "Medium12" -PivotNumberFormat "$#,##0.00" `
|
||||
Add-PivotTable -Address $excel.Sheet1.Cells["F1"] -SourceWorkSheet $Excel.Sheet1 -SourceRange $Excel.Sheet1.Dimension.Address -PivotTableName "Sales" -PivotTableStyle "Medium12" -PivotNumberFormat "$#,##0.00" `
|
||||
-PivotRows "City" -PivotColumns "Product" -PivotData @{Gross="Sum";Net="Sum"}-PivotTotals "Both" -Activate -PivotChartDefinition @{
|
||||
Title="Gross and net by city and product";
|
||||
ChartType="ColumnClustered";
|
||||
|
||||
171
Export-Excel.ps1
171
Export-Excel.ps1
@@ -1,21 +1,25 @@
|
||||
function Export-Excel {
|
||||
<#
|
||||
.SYNOPSIS
|
||||
Export data to an Excel worksheet.
|
||||
Exports data to an Excel worksheet.
|
||||
.DESCRIPTION
|
||||
Export data to an Excel file and where possible try to convert numbers so Excel recognizes them as numbers instead of text. After all. Excel is a spreadsheet program used for number manipulation and calculations. In case the number conversion is not desired, use the parameter '-NoNumberConversion *'.
|
||||
Exports data to an Excel file and where possible tries to convert numbers
|
||||
in text fields so Excel recognizes them as numbers instead of text.
|
||||
After all: Excel is a spreadsheet program used for number manipulation
|
||||
and calculations. If number conversion is not desired, use the
|
||||
parameter -NoNumberConversion *.
|
||||
.PARAMETER Path
|
||||
Path to a new or existing .XLSX file.
|
||||
.PARAMETER ExcelPackage
|
||||
An object representing an Excel Package - usually this is returned by specifying -Passthru allowing multiple commands to work on the same Workbook without saving and reloading each time.
|
||||
An object representing an Excel Package - usually this is returned by specifying -PassThru allowing multiple commands to work on the same workbook without saving and reloading each time.
|
||||
.PARAMETER WorksheetName
|
||||
The name of a sheet within the workbook - "Sheet1" by default.
|
||||
.PARAMETER ClearSheet
|
||||
If specified Export-Excel will remove any existing worksheet with the selected name. The Default behaviour is to overwrite cells in this sheet as needed (but leaving non-overwritten ones in place).
|
||||
.PARAMETER Append
|
||||
If specified data will be added to the end of an existing sheet, using the same column headings.
|
||||
If specified dat,a will be added to the end of an existing sheet, using the same column headings.
|
||||
.PARAMETER TargetData
|
||||
Data to insert onto the worksheet - this is often provided from the pipeline.
|
||||
Data to insert onto the worksheet - this is usually provided from the pipeline.
|
||||
.PARAMETER DisplayPropertySet
|
||||
Many (but not all) objects have a hidden property named psStandardmembers with a child property DefaultDisplayPropertySet ; this parameter reduces the properties exported to those in this set.
|
||||
.PARAMETER NoAliasOrScriptPropeties
|
||||
@@ -37,36 +41,36 @@
|
||||
.PARAMETER Password
|
||||
Sets password protection on the workbook.
|
||||
.PARAMETER IncludePivotTable
|
||||
Adds a Pivot table using the data in the worksheet.
|
||||
Adds a PivotTable using the data in the worksheet.
|
||||
.PARAMETER PivotTableName
|
||||
If a Pivot table is created from command line parameters, specifies the name of the new sheet holding the pivot. Defaults to "WorksheetName-PivotTable"
|
||||
If a PivotTable is created from command line parameters, specifies the name of the new sheet holding the pivot. Defaults to "WorksheetName-PivotTable".
|
||||
.PARAMETER PivotRows
|
||||
Name(s) columns from the spreadsheet which will provide the Row name(s) in a pivot table created from command line parameters.
|
||||
Name(s) of column(s) from the spreadsheet which will provide the Row name(s) in a PivotTable created from command line parameters.
|
||||
.PARAMETER PivotColumns
|
||||
Name(s) columns from the spreadsheet which will provide the Column name(s) in a pivot table created from command line parameters.
|
||||
Name(s) of columns from the spreadsheet which will provide the Column name(s) in a PivotTable created from command line parameters.
|
||||
.PARAMETER PivotFilter
|
||||
Name(s) columns from the spreadsheet which will provide the Filter name(s) in a pivot table created from command line parameters.
|
||||
Name(s) columns from the spreadsheet which will provide the Filter name(s) in a PivotTable created from command line parameters.
|
||||
.PARAMETER PivotData
|
||||
In a pivot table created from command line parameters, the fields to use in the table body are given as a Hash table in the form ColumnName = Average|Count|CountNums|Max|Min|Product|None|StdDev|StdDevP|Sum|Var|VarP.
|
||||
In a PivotTable created from command line parameters, the fields to use in the table body are given as a Hash table in the form ColumnName = Average|Count|CountNums|Max|Min|Product|None|StdDev|StdDevP|Sum|Var|VarP.
|
||||
.PARAMETER PivotDataToColumn
|
||||
If there are multiple datasets in a PivotTable, by default they are shown as separate rows under the given row heading; this switch makes them separate columns.
|
||||
.PARAMETER NoTotalsInPivot
|
||||
In a pivot table created from command line parameters, prevents the addition of totals to rows and columns.
|
||||
In a PivotTable created from command line parameters, prevents the addition of totals to rows and columns.
|
||||
.PARAMETER PivotTotals
|
||||
By default, Pivot tables have totals for each Row (on the right) and for each column at the bottom. This allows just one or neither to be selected.
|
||||
By default, PivotTables have totals for each row (on the right) and for each column at the bottom. This allows just one or neither to be selected.
|
||||
.PARAMETER PivotTableDefinition
|
||||
Instead of describing a single pivot table with multiple commandline parameters; you can use a hashTable in the form PivotTableName = Definition;
|
||||
Definition is itself a hashtable with Sheet, PivotRows, PivotColumns, PivotData, IncludePivotChart and ChartType values.
|
||||
Instead of describing a single PivotTable with multiple command-line parameters; you can use a HashTable in the form PivotTableName = Definition;
|
||||
Definition is itself a Hashtable with Sheet, PivotRows, PivotColumns, PivotData, IncludePivotChart and ChartType values.
|
||||
.PARAMETER IncludePivotChart
|
||||
Include a chart with the Pivot table - implies -IncludePivotTable.
|
||||
Include a chart with the PivotTable - implies -IncludePivotTable.
|
||||
.PARAMETER ChartType
|
||||
The type for Pivot chart (one of Excel's defined chart types)
|
||||
The type for PivotChart (one of Excel's defined chart types).
|
||||
.PARAMETER NoLegend
|
||||
Exclude the legend from the pivot chart.
|
||||
Exclude the legend from the PivotChart.
|
||||
.PARAMETER ShowCategory
|
||||
Add category labels to the pivot chart.
|
||||
Add category labels to the PivotChart.
|
||||
.PARAMETER ShowPercent
|
||||
Add Percentage labels to the pivot chart.
|
||||
Add percentage labels to the PivotChart.
|
||||
.PARAMETER ConditionalFormat
|
||||
One or more conditional formatting rules defined with New-ConditionalFormattingIconSet.
|
||||
.PARAMETER ConditionalText
|
||||
@@ -74,13 +78,13 @@
|
||||
.PARAMETER NoNumberConversion
|
||||
By default we convert all values to numbers if possible, but this isn't always desirable. NoNumberConversion allows you to add exceptions for the conversion. Wildcards (like '*') are allowed.
|
||||
.PARAMETER BoldTopRow
|
||||
Makes the top Row boldface.
|
||||
Makes the top row boldface.
|
||||
.PARAMETER NoHeader
|
||||
Does not put field names at the top of columns.
|
||||
.PARAMETER RangeName
|
||||
Makes the data in the worksheet a named range.
|
||||
.PARAMETER TableName
|
||||
Makes the data in the worksheet a table with a name applies a style to it. Name must not contain spaces.
|
||||
Makes the data in the worksheet a table with a name, and applies a style to it. Name must not contain spaces.
|
||||
.PARAMETER TableStyle
|
||||
Selects the style for the named table - defaults to 'Medium6'.
|
||||
.PARAMETER BarChart
|
||||
@@ -92,11 +96,11 @@
|
||||
.PARAMETER PieChart
|
||||
Creates a "quick" pie chart using the first text column as labels and the first numeric column as values
|
||||
.PARAMETER ExcelChartDefinition
|
||||
A hash table containing ChartType, Title, NoLegend, ShowCategory, ShowPercent, Yrange, Xrange and SeriesHeader for one or more [non-pivot] charts.
|
||||
A hash table containing ChartType, Title, NoLegend, ShowCategory, ShowPercent, Yrange, Xrange and SeriesHeader for one or more [non-Pivot] charts.
|
||||
.PARAMETER HideSheet
|
||||
Name(s) of Sheet(s) to hide in the workbook, supports wildcards. If all sheets would be hidden, the sheet being worked on will be revealed.
|
||||
Name(s) of Sheet(s) to hide in the workbook, supports wildcards. If the selection would cause all sheets to be hidden, the sheet being worked on will be revealed.
|
||||
.PARAMETER UnHideSheet
|
||||
Name(s) of Sheet(s) to Reveal in the workbook, supports wildcards.
|
||||
Name(s) of Sheet(s) to reveal in the workbook, supports wildcards.
|
||||
.PARAMETER MoveToStart
|
||||
If specified, the worksheet will be moved to the start of the workbook.
|
||||
-MoveToStart takes precedence over -MoveToEnd, -Movebefore and -MoveAfter if more than one is specified.
|
||||
@@ -126,13 +130,13 @@
|
||||
.PARAMETER FreezePane
|
||||
Freezes panes at specified coordinates (in the form RowNumber, ColumnNumber).
|
||||
.PARAMETER AutoFilter
|
||||
Enables the 'Filter' in Excel on the complete header row, so users can easily sort, filter and/or search the data in the selected column from within Excel.
|
||||
Enables the Excel filter on the complete header row, so users can easily sort, filter and/or search the data in the selected column.
|
||||
.PARAMETER AutoSize
|
||||
Sizes the width of the Excel column to the maximum width needed to display all the containing data in that cell.
|
||||
.PARAMETER Activate
|
||||
If there is already content in the workbook, a new sheet will not be active UNLESS Activate is specified; if a Pivot table is included it will be the active sheet
|
||||
If there is already content in the workbook, a new sheet will not be active UNLESS Activate is specified; if a PivotTable is included it will be the active sheet
|
||||
.PARAMETER Now
|
||||
The 'Now' switch is a shortcut that creates automatically a temporary file, enables 'AutoSize', 'AutoFiler' and 'Show', and opens the file immediately.
|
||||
The -Now switch is a shortcut that automatically creates a temporary file, enables "AutoSize", "AutoFiler" and "Show", and opens the file immediately.
|
||||
.PARAMETER NumberFormat
|
||||
Formats all values that can be converted to a number to the format specified.
|
||||
|
||||
@@ -162,7 +166,7 @@
|
||||
'[Blue]$#,##0.00;[Red]-$#,##0.00'
|
||||
|
||||
.PARAMETER ReZip
|
||||
If specified, Export-Excel will expand the contents of the .XLSX file (which is multiple files in a zip archive) and rebuilt it.
|
||||
If specified, Export-Excel will expand the contents of the .XLSX file (which is multiple files in a zip archive) and rebuild it.
|
||||
.PARAMETER NoClobber
|
||||
Not used. Left in to avoid problems with older scripts, it may be removed in future versions.
|
||||
.PARAMETER CellStyleSB
|
||||
@@ -171,7 +175,7 @@
|
||||
.PARAMETER Show
|
||||
Opens the Excel file immediately after creation. Convenient for viewing the results instantly without having to search for the file first.
|
||||
.PARAMETER ReturnRange
|
||||
If specified, Export-Excel returns the range of added cells in the format "A1:Z100"
|
||||
If specified, Export-Excel returns the range of added cells in the format "A1:Z100".
|
||||
.PARAMETER PassThru
|
||||
If specified, Export-Excel returns an object representing the Excel package without saving the package first.
|
||||
To save, you need to call Close-ExcelPackage or send the object back to Export-Excel, or use its .Save() or SaveAs() method.
|
||||
@@ -190,7 +194,9 @@
|
||||
Write-Output -1 668 34 777 860 -0.5 119 -0.1 234 788 |
|
||||
Export-Excel @ExcelParams -NumberFormat '[Blue]$#,##0.00;[Red]-$#,##0.00'
|
||||
|
||||
Exports all data to the Excel file 'Excel.xslx' and colors the negative values in 'Red' and the positive values in 'Blue'. It will also add a dollar sign '$' in front of the rounded numbers to two decimal characters behind the comma.
|
||||
Exports all data to the Excel file 'Excel.xslx' and colors the negative values
|
||||
in Red and the positive values in Blue. It will also add a dollar sign in front
|
||||
of the numbers which use a thousand seperator and display to two decimal places.
|
||||
|
||||
.EXAMPLE
|
||||
>
|
||||
@@ -216,7 +222,9 @@
|
||||
PhoneNr3 = '+3244444444'
|
||||
} | Export-Excel @ExcelParams -NoNumberConversion IPAddress, Number1
|
||||
|
||||
Exports all data to the Excel file 'Excel.xslx' and tries to convert all values to numbers where possible except for 'IPAddress' and 'Number1'. These are stored in the sheet 'as is', without being converted to a number.
|
||||
Exports all data to the Excel file "Excel.xlsx" and tries to convert all values
|
||||
to numbers where possible except for "IPAddress" and "Number1", which are
|
||||
stored in the sheet 'as is', without being converted to a number.
|
||||
|
||||
.EXAMPLE
|
||||
>
|
||||
@@ -242,7 +250,9 @@
|
||||
PhoneNr3 = '+3244444444'
|
||||
} | Export-Excel @ExcelParams -NoNumberConversion *
|
||||
|
||||
Exports all data to the Excel file 'Excel.xslx' as is, no number conversion will take place. This means that Excel will show the exact same data that you handed over to the 'Export-Excel' function.
|
||||
Exports all data to the Excel file 'Excel.xslx' as is, no number conversion
|
||||
will take place. This means that Excel will show the exact same data that
|
||||
you handed over to the 'Export-Excel' function.
|
||||
|
||||
.EXAMPLE
|
||||
>
|
||||
@@ -257,9 +267,11 @@
|
||||
New-ConditionalText -ConditionalType GreaterThan 525 -ConditionalTextColor DarkRed -BackgroundColor LightPink
|
||||
)
|
||||
|
||||
Exports data that will have a 'Conditional formatting rule' in Excel on these cells that will show the background fill color in
|
||||
'LightPink' and the text color in 'DarkRed' when the value is greater than '525'. In case this condition is not met the color will
|
||||
be the default, black text on a white background.
|
||||
Exports data that will have a Conditional Formatting rule in Excel
|
||||
that will show cells with a value is greater than 525, whith a
|
||||
background fill color of "LightPink" and the text in "DarkRed".
|
||||
Where condition is not met the color willbe the default, black
|
||||
text on a white background.
|
||||
|
||||
.EXAMPLE
|
||||
>
|
||||
@@ -275,7 +287,12 @@
|
||||
New-ConditionalText Running Blue Cyan
|
||||
)
|
||||
|
||||
Export all services to an Excel sheet where all cells have a 'Conditional formatting rule' in Excel that will show the background fill color in 'LightPink' and the text color in 'DarkRed' when the value contains the word 'Stop'. If the value contains the word 'Running' it will have a background fill color in 'Cyan' and a text color 'Blue'. In case none of these conditions are met the color will be the default, black text on a white background.
|
||||
Exports all services to an Excel sheet, setting a Conditional formatting rule
|
||||
that will set the background fill color to "LightPink" and the text color
|
||||
to "DarkRed" when the value contains the word "Stop".
|
||||
If the value contains the word "Running" it will have a background fill
|
||||
color of "Cyan" and text colored 'Blue'. If neither condition is met, the
|
||||
color will be the default, black text on a white background.
|
||||
|
||||
.EXAMPLE
|
||||
>
|
||||
@@ -310,7 +327,8 @@
|
||||
$Array | Out-GridView -Title 'Not showing Member3 and Member4'
|
||||
$Array | Update-FirstObjectProperties | Export-Excel @ExcelParams -WorksheetName Numbers
|
||||
|
||||
Updates the first object of the array by adding property 'Member3' and 'Member4'. Afterwards. all objects are exported to an Excel file and all column headers are visible.
|
||||
Updates the first object of the array by adding property 'Member3' and 'Member4'.
|
||||
Afterwards. all objects are exported to an Excel file and all column headers are visible.
|
||||
|
||||
.EXAMPLE
|
||||
Get-Process | Export-Excel .\test.xlsx -WorksheetName Processes -IncludePivotTable -Show -PivotRows Company -PivotData PM
|
||||
@@ -341,10 +359,10 @@
|
||||
Get-Process | Select-Object -Property Name,Company,Handles,CPU,VM | Export-Excel -Path .\test.xlsx -AutoSize -WorksheetName 'sheet2'
|
||||
Export-Excel -Path .\test.xlsx -PivotTableDefinition $pt -Show
|
||||
|
||||
This example defines two pivot tables. Then it puts Service data on Sheet1 with one call to Export-Excel and Process Data on sheet2 with a second call to Export-Excel.
|
||||
The third and final call adds the two pivot tables and opens the spreadsheet in Excel.
|
||||
|
||||
|
||||
This example defines two PivotTables. Then it puts Service data on Sheet1
|
||||
with one call to Export-Excel and Process Data on sheet2 with a second
|
||||
call to Export-Excel. The third and final call adds the two PivotTables
|
||||
and opens the spreadsheet in Excel.
|
||||
.EXAMPLE
|
||||
>
|
||||
PS> Remove-Item -Path .\test.xlsx
|
||||
@@ -356,8 +374,11 @@
|
||||
$excel.Dispose()
|
||||
Start-Process .\test.xlsx
|
||||
|
||||
This example uses -passthrough. It puts service information into sheet1 of the workbook and saves the ExcelPackageObject in $Excel.
|
||||
It then uses the package object to apply formatting, and then saves the workbook and disposes of the object before loading the document in Excel.
|
||||
This example uses -PassThru. It puts service information into sheet1 of the
|
||||
workbook and saves the ExcelPackage object in $Excel. It then uses the package
|
||||
object to apply formatting, and then saves the workbook and disposes of the object
|
||||
before loading the document in Excel. Other commands in the module remove the need
|
||||
to work directly with the package object in this way.
|
||||
|
||||
.EXAMPLE
|
||||
>
|
||||
@@ -375,12 +396,23 @@
|
||||
foreach ($c in 5..9) {Set-ExcelRange -Address $sheet.Column($c) -AutoFit }
|
||||
Export-Excel -ExcelPackage $excel -WorksheetName "Processes" -IncludePivotChart -ChartType ColumnClustered -NoLegend -PivotRows company -PivotData @{'Name'='Count'} -Show
|
||||
|
||||
This a more sophisticated version of the previous example showing different ways of using Set-ExcelRange, and also adding conditional formatting.
|
||||
In the final command a Pivot chart is added and the workbook is opened in Excel.
|
||||
This a more sophisticated version of the previous example showing different
|
||||
ways of using Set-ExcelRange, and also adding conditional formatting.
|
||||
In the final command a PivotChart is added and the workbook is opened in Excel.
|
||||
.EXAMPLE
|
||||
0..360 | ForEach-Object {[pscustomobject][ordered]@{X=$_; Sinx="=Sin(Radians(x)) "} } | Export-Excel -now -LineChart -AutoNameRange
|
||||
|
||||
Creates a line chart showing the value of Sine(x) for values of X between 0 and 360 degrees.
|
||||
|
||||
.EXAMPLE
|
||||
>
|
||||
PS> Invoke-Sqlcmd -ServerInstance localhost\DEFAULT -Database AdventureWorks2014 -Query "select * from sys.tables" -OutputAs DataRows |
|
||||
Export-Excel -Path .\SysTables_AdventureWorks2014.xlsx -WorksheetName Tables
|
||||
|
||||
Runs a query against a SQL Server database and outputs the resulting rows DataRows using the -OutputAs parameter.
|
||||
The results are then piped to the Export-Excel function.
|
||||
NOTE: You need to install the SqlServer module from the PowerShell Gallery in oder to get the -OutputAs parameter for the Invoke-Sqlcmd cmdlet.
|
||||
|
||||
.LINK
|
||||
https://github.com/dfinke/ImportExcel
|
||||
#>
|
||||
@@ -406,7 +438,7 @@
|
||||
[OfficeOpenXml.Style.ExcelFillStyle]$TitleFillPattern = 'Solid',
|
||||
[Switch]$TitleBold,
|
||||
[Int]$TitleSize = 22,
|
||||
[System.Drawing.Color]$TitleBackgroundColor,
|
||||
$TitleBackgroundColor,
|
||||
[Switch]$IncludePivotTable,
|
||||
[String]$PivotTableName,
|
||||
[String[]]$PivotRows,
|
||||
@@ -472,12 +504,12 @@
|
||||
[Object[]]$ConditionalFormat,
|
||||
[Object[]]$ConditionalText,
|
||||
[ScriptBlock]$CellStyleSB,
|
||||
#If there is already content in the workbook the sheet with the Pivot table will not be active UNLESS Activate is specified
|
||||
#If there is already content in the workbook the sheet with the PivotTable will not be active UNLESS Activate is specified
|
||||
[switch]$Activate,
|
||||
[Parameter(ParameterSetName = 'Now')]
|
||||
[Switch]$Now,
|
||||
[Switch]$ReturnRange,
|
||||
#By default Pivot tables have Totals for each Row (on the right) and for each column at the bottom. This allows just one or neither to be selected.
|
||||
#By default PivotTables have Totals for each Row (on the right) and for each column at the bottom. This allows just one or neither to be selected.
|
||||
[ValidateSet("Both","Columns","Rows","None")]
|
||||
[String]$PivotTotals = "Both",
|
||||
#Included for compatibility - equivalent to -PivotTotals "None"
|
||||
@@ -642,6 +674,7 @@
|
||||
|
||||
$row = $ws.Dimension.End.Row
|
||||
Write-Debug -Message ("Appending: headers are " + ($script:Header -join ", ") + " Start row is $row")
|
||||
if ($Title) {Write-Warning -Message "-Title Parameter is ignored when appending."}
|
||||
}
|
||||
elseif ($Title) {
|
||||
#Can only add a title if not appending!
|
||||
@@ -649,12 +682,13 @@
|
||||
$ws.Cells[$Row, $StartColumn].Value = $Title
|
||||
$ws.Cells[$Row, $StartColumn].Style.Font.Size = $TitleSize
|
||||
|
||||
if ($TitleBold) {
|
||||
if ($PSBoundParameters.ContainsKey("TitleBold")) {
|
||||
#Set title to Bold face font if -TitleBold was specified.
|
||||
#Otherwise the default will be unbolded.
|
||||
$ws.Cells[$Row, $StartColumn].Style.Font.Bold = $True
|
||||
$ws.Cells[$Row, $StartColumn].Style.Font.Bold = [boolean]$TitleBold
|
||||
}
|
||||
if ($TitleBackgroundColor ) {
|
||||
if ($TitleBackgroundColor -is [string]) {$TitleBackgroundColor = [System.Drawing.Color]::$TitleBackgroundColor }
|
||||
$ws.Cells[$Row, $StartColumn].Style.Fill.PatternType = $TitleFillPattern
|
||||
$ws.Cells[$Row, $StartColumn].Style.Fill.BackgroundColor.SetColor($TitleBackgroundColor)
|
||||
}
|
||||
@@ -729,7 +763,7 @@
|
||||
|
||||
foreach ($Name in $script:Header) {
|
||||
try {Add-CellValue -TargetCell $ws.Cells[$Row, $ColumnIndex] -CellValue $TargetData.$Name}
|
||||
catch {Write-Warning -Message "Could not insert the $Name property at Row $Row, Column $Column"}
|
||||
catch {Write-Warning -Message "Could not insert the '$Name' property at Row $Row, Column $ColumnIndex"}
|
||||
$ColumnIndex += 1
|
||||
}
|
||||
$ColumnIndex -= 1 # column index will be the last column whether isDataTypeValueType was true or false
|
||||
@@ -787,6 +821,7 @@
|
||||
}
|
||||
catch {Write-Warning -Message "Failed adding named ranges to worksheet '$WorksheetName': $_" }
|
||||
}
|
||||
#Empty string is not allowed as a name for ranges or tables.
|
||||
if ($RangeName) { Add-ExcelName -Range $ws.Cells[$dataRange] -RangeName $RangeName}
|
||||
|
||||
if ($TableName) {
|
||||
@@ -823,7 +858,7 @@
|
||||
'SourceRange' = $dataRange
|
||||
}
|
||||
if ($PivotTableName -and ($pkg.workbook.worksheets.tables.name -contains $PivotTableName)) {
|
||||
Write-Warning -Message "The selected Pivot table name '$PivotTableName' is already used as a table name. Adding a suffix of 'Pivot'."
|
||||
Write-Warning -Message "The selected PivotTable name '$PivotTableName' is already used as a table name. Adding a suffix of 'Pivot'."
|
||||
$PivotTableName += 'Pivot'
|
||||
}
|
||||
|
||||
@@ -861,22 +896,22 @@
|
||||
$ws.View.FreezePanes(1, 2)
|
||||
Write-Verbose -Message "Froze first column"
|
||||
}
|
||||
|
||||
#Must be 1..maxrows or and array of 1..maxRows,1..MaxCols
|
||||
if ($FreezePane) {
|
||||
$freezeRow, $freezeColumn = $FreezePane
|
||||
if (-not $freezeColumn -or $freezeColumn -eq 0) {
|
||||
$freezeColumn = 1
|
||||
}
|
||||
|
||||
if ($freezeRow -gt 1) {
|
||||
if ($freezeRow -ge 1) {
|
||||
$ws.View.FreezePanes($freezeRow, $freezeColumn)
|
||||
Write-Verbose -Message "Froze pandes at row $freezeRow and column $FreezeColumn"
|
||||
Write-Verbose -Message "Froze panes at row $freezeRow and column $FreezeColumn"
|
||||
}
|
||||
}
|
||||
}
|
||||
catch {Write-Warning -Message "Failed adding Freezing the panes in worksheet '$WorksheetName': $_"}
|
||||
|
||||
if ($BoldTopRow) { #it sets bold as far as there are populated cells: for whole row could do $ws.row($x).style.font.bold = $true
|
||||
if ($PSBoundParameters.ContainsKey("BoldTopRow")) { #it sets bold as far as there are populated cells: for whole row could do $ws.row($x).style.font.bold = $true
|
||||
try {
|
||||
if ($Title) {
|
||||
$range = $ws.Dimension.Address -replace '\d+', ($StartRow + 1)
|
||||
@@ -884,7 +919,7 @@
|
||||
else {
|
||||
$range = $ws.Dimension.Address -replace '\d+', $StartRow
|
||||
}
|
||||
$ws.Cells[$range].Style.Font.Bold = $true
|
||||
$ws.Cells[$range].Style.Font.Bold = [boolean]$BoldTopRow
|
||||
Write-Verbose -Message "Set $range font style to bold."
|
||||
}
|
||||
catch {Write-Warning -Message "Failed setting the top row to bold in worksheet '$WorksheetName': $_"}
|
||||
@@ -991,7 +1026,7 @@
|
||||
Write-Verbose -Message "Added conditional formatting to range $($c.range)"
|
||||
}
|
||||
elseif ($c -is [hashtable] -or $c -is[System.Collections.Specialized.OrderedDictionary]) {
|
||||
if (-not $c.Range) {$c.Range = $ws.Dimension.Address }
|
||||
if (-not $c.Range -or $c.Address) {$c.Address = $ws.Dimension.Address }
|
||||
Add-ConditionalFormatting -WorkSheet $ws @c
|
||||
}
|
||||
}
|
||||
@@ -1007,6 +1042,7 @@
|
||||
catch {Write-Warning -Message "Failed processing CellStyleSB in worksheet '$WorksheetName': $_"}
|
||||
}
|
||||
|
||||
#Can only add password, may want to support -password $Null removing password.
|
||||
if ($Password) {
|
||||
try {
|
||||
$ws.Protection.SetPassword($Password)
|
||||
@@ -1173,7 +1209,7 @@ function Select-Worksheet {
|
||||
Sets the selected tab in an Excel workbook to be the chosen sheet and unselects all the others.
|
||||
.DESCRIPTION
|
||||
Sometimes when a sheet is added we want it to be the active sheet, sometimes we want the active sheet to be left as it was.
|
||||
Select-Worksheet exists to change the which sheet is the selected tab when Excel opens the file.
|
||||
Select-Worksheet exists to change which sheet is the selected tab when Excel opens the file.
|
||||
.EXAMPLE
|
||||
Select-Worksheet -ExcelWorkbook $ExcelWorkbook -WorksheetName "NewSheet"
|
||||
$ExcelWorkbook holds a workbook object containing a sheet named "NewSheet";
|
||||
@@ -1184,10 +1220,11 @@ function Select-Worksheet {
|
||||
This sheet will become the [only] active sheet in the workbook.
|
||||
.EXAMPLE
|
||||
Select-Worksheet -ExcelWorksheet $ws
|
||||
$ws holds an Excel worksheet which will become the [only] active sheet in the workbook.
|
||||
$ws holds an Excel worksheet which will become the [only] active sheet
|
||||
in its workbook.
|
||||
#>
|
||||
param (
|
||||
#An object representing an Excel Package.
|
||||
#An object representing an ExcelPackage.
|
||||
[Parameter(Mandatory = $true, ValueFromPipeline = $true, ParameterSetName = 'Package', Position = 0)]
|
||||
[OfficeOpenXml.ExcelPackage]$ExcelPackage,
|
||||
#An Excel workbook to which the Worksheet will be added - a package contains one Workbook so you can use workbook or package as it suits.
|
||||
@@ -1195,7 +1232,7 @@ function Select-Worksheet {
|
||||
[OfficeOpenXml.ExcelWorkbook]$ExcelWorkbook,
|
||||
[Parameter(ParameterSetName='Package')]
|
||||
[Parameter(ParameterSetName='Workbook')]
|
||||
#The name of the worksheet 'Sheet1' by default.
|
||||
#The name of the worksheet "Sheet1" by default.
|
||||
[string]$WorksheetName,
|
||||
#An object representing an Excel worksheet.
|
||||
[Parameter(ParameterSetName='Sheet',Mandatory=$true)]
|
||||
@@ -1303,6 +1340,14 @@ function Add-ExcelTable {
|
||||
[Switch]$PassThru
|
||||
)
|
||||
try {
|
||||
if ([OfficeOpenXml.FormulaParsing.ExcelUtilities.ExcelAddressUtil]::IsValidAddress($TableName)) {
|
||||
Write-Warning -Message "$tableName reads as an Excel address, and so is not allowed as a table name."
|
||||
return
|
||||
}
|
||||
if ($tableName -notMatch '^[A-Z]') {
|
||||
Write-Warning -Message "$tableName is not allowed as a table name because it does not begin with a letter."
|
||||
return
|
||||
}
|
||||
if ($TableName -match "\W") {
|
||||
Write-Warning -Message "At least one character in $TableName is illegal in a table name and will be replaced with '_' . "
|
||||
$TableName = $TableName -replace '\W', '_'
|
||||
|
||||
28
Export-StocksToExcel.ps1
Normal file
28
Export-StocksToExcel.ps1
Normal file
@@ -0,0 +1,28 @@
|
||||
function Export-StocksToExcel {
|
||||
param(
|
||||
[string]$symbols,
|
||||
[ValidateSet("Open", "High", "Low", "Close", "Volume")]
|
||||
$measure = "Open"
|
||||
)
|
||||
|
||||
$xl = "$env:TEMP\Stocks.xlsx"
|
||||
|
||||
Remove-Item $xl -ErrorAction SilentlyContinue
|
||||
|
||||
$r = Invoke-RestMethod "https://azfnstockdata-fn83fffd32.azurewebsites.net/api/GetQuoteChart?symbol=$($symbols)"
|
||||
|
||||
$chartColumn = $symbols.Split(',').count + 2
|
||||
$ptd = New-PivotTableDefinition `
|
||||
-SourceWorkSheet Sheet1 `
|
||||
-PivotTableName result `
|
||||
-PivotData @{$measure = 'sum'} `
|
||||
-PivotRows date `
|
||||
-PivotColumns symbol `
|
||||
-ChartType Line `
|
||||
-ChartTitle "Stock - $measure " `
|
||||
-IncludePivotChart -NoTotalsInPivot -ChartColumn $chartColumn -ChartRow 3 -Activate
|
||||
|
||||
$r | Sort-Object Date, symbol | Export-Excel $xl -PivotTableDefinition $ptd -AutoSize -AutoFilter -Show
|
||||
}
|
||||
|
||||
# Export-StocksToExcel -symbols 'ibm,aapl,msft' -measure High
|
||||
BIN
ImportExcel-5.4.2-20181217155848.zip
Normal file
BIN
ImportExcel-5.4.2-20181217155848.zip
Normal file
Binary file not shown.
@@ -4,7 +4,7 @@
|
||||
RootModule = 'ImportExcel.psm1'
|
||||
|
||||
# Version number of this module.
|
||||
ModuleVersion = '5.3.3'
|
||||
ModuleVersion = '5.4.3'
|
||||
|
||||
# ID used to uniquely identify this module
|
||||
GUID = '60dd4136-feff-401a-ba27-a84458c57ede'
|
||||
|
||||
202
ImportExcel.psm1
202
ImportExcel.psm1
@@ -1,69 +1,71 @@
|
||||
#region import everything we need
|
||||
Add-Type -Path "$($PSScriptRoot)\EPPlus.dll"
|
||||
. $PSScriptRoot\AddConditionalFormatting.ps1
|
||||
. $PSScriptRoot\Charting.ps1
|
||||
. $PSScriptRoot\ColorCompletion.ps1
|
||||
. $PSScriptRoot\ConvertExcelToImageFile.ps1
|
||||
. $PSScriptRoot\Compare-WorkSheet.ps1
|
||||
. $PSScriptRoot\ConvertFromExcelData.ps1
|
||||
. $PSScriptRoot\ConvertFromExcelToSQLInsert.ps1
|
||||
. $PSScriptRoot\ConvertToExcelXlsx.ps1
|
||||
. $PSScriptRoot\Copy-ExcelWorkSheet.ps1
|
||||
. $PSScriptRoot\Export-Excel.ps1
|
||||
. $PSScriptRoot\Export-ExcelSheet.ps1
|
||||
. $PSScriptRoot\Get-ExcelColumnName.ps1
|
||||
. $PSScriptRoot\Get-ExcelSheetInfo.ps1
|
||||
. $PSScriptRoot\Get-ExcelWorkbookInfo.ps1
|
||||
. $PSScriptRoot\Get-HtmlTable.ps1
|
||||
. $PSScriptRoot\Get-Range.ps1
|
||||
. $PSScriptRoot\Get-XYRange.ps1
|
||||
. $PSScriptRoot\Import-Html.ps1
|
||||
. $PSScriptRoot\InferData.ps1
|
||||
. $PSScriptRoot\Invoke-Sum.ps1
|
||||
. $PSScriptRoot\Join-WorkSheet.ps1
|
||||
. $PSScriptRoot\Merge-Worksheet.ps1
|
||||
. $PSScriptRoot\New-ConditionalFormattingIconSet.ps1
|
||||
. $PSScriptRoot\New-ConditionalText.ps1
|
||||
. $PSScriptRoot\New-ExcelChart.ps1
|
||||
. $PSScriptRoot\New-PSItem.ps1
|
||||
. $PSScriptRoot\Open-ExcelPackage.ps1
|
||||
. $PSScriptRoot\Pivot.ps1
|
||||
. $PSScriptRoot\PivotTable.ps1
|
||||
. $PSScriptRoot\Send-SQLDataToExcel.ps1
|
||||
. $PSScriptRoot\Set-CellStyle.ps1
|
||||
. $PSScriptRoot\Set-Column.ps1
|
||||
. $PSScriptRoot\Set-Row.ps1
|
||||
. $PSScriptRoot\SetFormat.ps1
|
||||
. $PSScriptRoot\TrackingUtils.ps1
|
||||
. $PSScriptRoot\Update-FirstObjectProperties.ps1
|
||||
Add-Type -Path "$($PSScriptRoot)\EPPlus.dll"
|
||||
. $PSScriptRoot\AddConditionalFormatting.ps1
|
||||
. $PSScriptRoot\Charting.ps1
|
||||
. $PSScriptRoot\ColorCompletion.ps1
|
||||
. $PSScriptRoot\ConvertExcelToImageFile.ps1
|
||||
. $PSScriptRoot\Compare-WorkSheet.ps1
|
||||
. $PSScriptRoot\ConvertFromExcelData.ps1
|
||||
. $PSScriptRoot\ConvertFromExcelToSQLInsert.ps1
|
||||
. $PSScriptRoot\ConvertToExcelXlsx.ps1
|
||||
. $PSScriptRoot\Copy-ExcelWorkSheet.ps1
|
||||
. $PSScriptRoot\Export-Excel.ps1
|
||||
. $PSScriptRoot\Export-ExcelSheet.ps1
|
||||
. $PSScriptRoot\Export-StocksToExcel.ps1
|
||||
. $PSScriptRoot\Get-ExcelColumnName.ps1
|
||||
. $PSScriptRoot\Get-ExcelSheetInfo.ps1
|
||||
. $PSScriptRoot\Get-ExcelWorkbookInfo.ps1
|
||||
. $PSScriptRoot\Get-HtmlTable.ps1
|
||||
. $PSScriptRoot\Get-Range.ps1
|
||||
. $PSScriptRoot\Get-XYRange.ps1
|
||||
. $PSScriptRoot\Import-Html.ps1
|
||||
. $PSScriptRoot\InferData.ps1
|
||||
. $PSScriptRoot\Invoke-Sum.ps1
|
||||
. $PSScriptRoot\Join-WorkSheet.ps1
|
||||
. $PSScriptRoot\Merge-Worksheet.ps1
|
||||
. $PSScriptRoot\New-ConditionalFormattingIconSet.ps1
|
||||
. $PSScriptRoot\New-ConditionalText.ps1
|
||||
. $PSScriptRoot\New-ExcelChart.ps1
|
||||
. $PSScriptRoot\New-PSItem.ps1
|
||||
. $PSScriptRoot\Open-ExcelPackage.ps1
|
||||
. $PSScriptRoot\Pivot.ps1
|
||||
. $PSScriptRoot\PivotTable.ps1
|
||||
. $PSScriptRoot\RemoveWorksheet.ps1
|
||||
. $PSScriptRoot\Send-SQLDataToExcel.ps1
|
||||
. $PSScriptRoot\Set-CellStyle.ps1
|
||||
. $PSScriptRoot\Set-Column.ps1
|
||||
. $PSScriptRoot\Set-Row.ps1
|
||||
. $PSScriptRoot\SetFormat.ps1
|
||||
. $PSScriptRoot\TrackingUtils.ps1
|
||||
. $PSScriptRoot\Update-FirstObjectProperties.ps1
|
||||
|
||||
|
||||
New-Alias -Name Use-ExcelData -Value "ConvertFrom-ExcelData" -Force
|
||||
New-Alias -Name Use-ExcelData -Value "ConvertFrom-ExcelData" -Force
|
||||
|
||||
if ($PSVersionTable.PSVersion.Major -ge 5) {
|
||||
. $PSScriptRoot\Plot.ps1
|
||||
if ($PSVersionTable.PSVersion.Major -ge 5) {
|
||||
. $PSScriptRoot\Plot.ps1
|
||||
|
||||
Function New-Plot {
|
||||
Param()
|
||||
|
||||
[PSPlot]::new()
|
||||
}
|
||||
Function New-Plot {
|
||||
Param()
|
||||
|
||||
[PSPlot]::new()
|
||||
}
|
||||
else {
|
||||
Write-Warning 'PowerShell 5 is required for plot.ps1'
|
||||
Write-Warning 'PowerShell Excel is ready, except for that functionality'
|
||||
}
|
||||
|
||||
}
|
||||
else {
|
||||
Write-Warning 'PowerShell 5 is required for plot.ps1'
|
||||
Write-Warning 'PowerShell Excel is ready, except for that functionality'
|
||||
}
|
||||
#endregion
|
||||
function Import-Excel {
|
||||
<#
|
||||
<#
|
||||
.SYNOPSIS
|
||||
Create custom objects from the rows in an Excel worksheet.
|
||||
|
||||
.DESCRIPTION
|
||||
The Import-Excel cmdlet creates custom objects from the rows in an Excel worksheet. Each row represents one object. All of this is possible without installing Microsoft Excel and by using the .NET library ‘EPPLus.dll’.
|
||||
|
||||
By default, the property names of the objects are retrieved from the column headers. Because an object cannot have a blanc property name, only columns with column headers will be imported.
|
||||
By default, the property names of the objects are retrieved from the column headers. Because an object cannot have a blank property name, only columns with column headers will be imported.
|
||||
|
||||
If the default behavior is not desired and you want to import the complete worksheet ‘as is’, the parameter ‘-NoHeader’ can be used. In case you want to provide your own property names, you can use the parameter ‘-HeaderName’.
|
||||
|
||||
@@ -221,7 +223,7 @@ function Import-Excel {
|
||||
|
||||
Notice that empty rows and empty columns are not imported.
|
||||
|
||||
.EXAMPLE
|
||||
.EXAMPLE
|
||||
Import data from an Excel worksheet. One object is created for each row. The property names are provided with the ‘-HeaderName’ parameter. The import will start from row 2 and empty columns and rows are not imported.
|
||||
|
||||
----------------------------------------------------------
|
||||
@@ -241,6 +243,16 @@ function Import-Excel {
|
||||
|
||||
Notice that only 1 object is imported with only 3 properties. Column B and row 2 are empty and have been disregarded by using the switch '-DataOnly'. The property names have been named with the values provided with the parameter '-HeaderName'. Row number 1 with ‘Chuck Norris’ has not been imported, because we started the import from row 2 with the parameter ‘-StartRow 2’.
|
||||
|
||||
.EXAMPLE
|
||||
>
|
||||
PS> ,(Import-Excel -Path .\SysTables_AdventureWorks2014.xlsx) |
|
||||
Write-SqlTableData -ServerInstance localhost\DEFAULT -Database BlankDB -SchemaName dbo -TableName MyNewTable_fromExcel -Force
|
||||
|
||||
Imports data from an Excel file and pipe the data to the Write-SqlTableData to be INSERTed into a table in a SQL Server database.
|
||||
The ",( ... )" around the Import-Excel command allows all rows to be imported from the Excel file, prior to pipelining to the Write-SqlTableData cmdlet. This helps prevent a RBAR scenario and is important when trying to import thousands of rows.
|
||||
The -Force parameter will be ignored if the table already exists. However, if a table is not found that matches the values provided by -SchemaName and -TableName parameters, it will create a new table in SQL Server database. The Write-SqlTableData cmdlet will inherit the column names & datatypes for the new table from the object being piped in.
|
||||
NOTE: You need to install the SqlServer module from the PowerShell Gallery in oder to get the Write-SqlTableData cmdlet.
|
||||
|
||||
.LINK
|
||||
https://github.com/dfinke/ImportExcel
|
||||
|
||||
@@ -248,24 +260,24 @@ function Import-Excel {
|
||||
#>
|
||||
|
||||
[CmdLetBinding(DefaultParameterSetName)]
|
||||
[Diagnostics.CodeAnalysis.SuppressMessageAttribute("PSAvoidUsingPlainTextForPassword","")]
|
||||
[Diagnostics.CodeAnalysis.SuppressMessageAttribute("PSAvoidUsingPlainTextForPassword", "")]
|
||||
Param (
|
||||
[Alias('FullName')]
|
||||
[Parameter(ValueFromPipelineByPropertyName, ValueFromPipeline, Position=0, Mandatory)]
|
||||
[Parameter(ValueFromPipelineByPropertyName, ValueFromPipeline, Position = 0, Mandatory)]
|
||||
[ValidateScript( {(Test-Path -Path $_ -PathType Leaf) -and ($_ -match '.xls$|.xlsx$|.xlsm$')})]
|
||||
[String]$Path,
|
||||
[Alias('Sheet')]
|
||||
[Parameter(Position=1)]
|
||||
[Parameter(Position = 1)]
|
||||
[ValidateNotNullOrEmpty()]
|
||||
[String]$WorksheetName,
|
||||
[Parameter(ParameterSetName='B', Mandatory)]
|
||||
[Parameter(ParameterSetName = 'B', Mandatory)]
|
||||
[String[]]$HeaderName ,
|
||||
[Parameter(ParameterSetName='C', Mandatory)]
|
||||
[Parameter(ParameterSetName = 'C', Mandatory)]
|
||||
[Switch]$NoHeader ,
|
||||
[Alias('HeaderRow','TopRow')]
|
||||
[Alias('HeaderRow', 'TopRow')]
|
||||
[ValidateRange(1, 9999)]
|
||||
[Int]$StartRow = 1,
|
||||
[Alias('StopRow','BottomRow')]
|
||||
[Alias('StopRow', 'BottomRow')]
|
||||
[Int]$EndRow ,
|
||||
[Alias('LeftColumn')]
|
||||
[Int]$StartColumn = 1,
|
||||
@@ -295,13 +307,13 @@ function Import-Excel {
|
||||
$i = 0
|
||||
foreach ($C in $Columns) {
|
||||
$i++
|
||||
$C | Select-Object @{N='Column'; E={$_}}, @{N='Value'; E={'P' + $i}}
|
||||
$C | Select-Object @{N = 'Column'; E = {$_}}, @{N = 'Value'; E = {'P' + $i}}
|
||||
}
|
||||
}
|
||||
elseif ($HeaderName) {
|
||||
$i = 0
|
||||
foreach ($H in $HeaderName) {
|
||||
$H | Select-Object @{N='Column'; E={$Columns[$i]}}, @{N='Value'; E={$H}}
|
||||
$H | Select-Object @{N = 'Column'; E = {$Columns[$i]}}, @{N = 'Value'; E = {$H}}
|
||||
$i++
|
||||
}
|
||||
}
|
||||
@@ -311,7 +323,7 @@ function Import-Excel {
|
||||
}
|
||||
|
||||
foreach ($C in $Columns) {
|
||||
$Worksheet.Cells[$StartRow,$C] | Where-Object {$_.Value} | Select-Object @{N='Column'; E={$C}}, Value
|
||||
$Worksheet.Cells[$StartRow, $C] | Where-Object {$_.Value} | Select-Object @{N = 'Column'; E = {$C}}, Value
|
||||
}
|
||||
}
|
||||
}
|
||||
@@ -327,16 +339,18 @@ function Import-Excel {
|
||||
$Path = (Resolve-Path $Path).ProviderPath
|
||||
Write-Verbose "Import Excel workbook '$Path' with worksheet '$Worksheetname'"
|
||||
$Stream = New-Object -TypeName System.IO.FileStream -ArgumentList $Path, 'Open', 'Read', 'ReadWrite'
|
||||
}
|
||||
Catch {throw "Could not open $Path ; $_ "}
|
||||
}
|
||||
Catch {throw "Could not open $Path ; $_ "}
|
||||
|
||||
if ($Password) {
|
||||
Try {$Excel = New-Object -TypeName OfficeOpenXml.ExcelPackage
|
||||
$excel.Load( $Stream,$Password)}
|
||||
Try {
|
||||
$Excel = New-Object -TypeName OfficeOpenXml.ExcelPackage
|
||||
$excel.Load( $Stream, $Password)
|
||||
}
|
||||
Catch { throw "Could not read $Path with the provided password." }
|
||||
}
|
||||
else {
|
||||
try {$Excel = New-Object -TypeName OfficeOpenXml.ExcelPackage -ArgumentList $Stream}
|
||||
try {$Excel = New-Object -TypeName OfficeOpenXml.ExcelPackage -ArgumentList $Stream}
|
||||
Catch {throw "Failed to read $Path"}
|
||||
}
|
||||
#endregion
|
||||
@@ -354,13 +368,13 @@ function Import-Excel {
|
||||
Write-Debug $sw.Elapsed.TotalMilliseconds
|
||||
#region Get rows and columns
|
||||
#If we are doing dataonly it is quicker to work out which rows to ignore before processing the cells.
|
||||
if (-not $EndRow ) {$EndRow = $Worksheet.Dimension.End.Row }
|
||||
if (-not $EndRow ) {$EndRow = $Worksheet.Dimension.End.Row }
|
||||
if (-not $EndColumn) {$EndColumn = $Worksheet.Dimension.End.Column }
|
||||
$endAddress = [OfficeOpenXml.ExcelAddress]::TranslateFromR1C1("R[$EndRow]C[$EndColumn]",0,0)
|
||||
$endAddress = [OfficeOpenXml.ExcelAddress]::TranslateFromR1C1("R[$EndRow]C[$EndColumn]", 0, 0)
|
||||
if ($DataOnly) {
|
||||
#If we are using headers startrow will be the headerrow so examine data from startRow + 1,
|
||||
if ($NoHeader) {$range = "A" + ($StartRow ) + ":" + $endAddress }
|
||||
else {$range = "A" + ($StartRow + 1 ) + ":" + $endAddress }
|
||||
else {$range = "A" + ($StartRow + 1 ) + ":" + $endAddress }
|
||||
#We're going to look at every cell and build 2 hash tables holding rows & columns which contain data.
|
||||
#Want to Avoid 'select unique' operations & large Sorts, becuse time time taken increases with square
|
||||
#of number of items (PS uses heapsort at large size). Instead keep a list of what we have seen,
|
||||
@@ -368,15 +382,15 @@ function Import-Excel {
|
||||
$colHash = @{}
|
||||
$rowHash = @{}
|
||||
foreach ($cell in $Worksheet.Cells[$range]) {
|
||||
if ($null -ne $cell.Value ) {$colHash[$cell.Start.Column]=1; $rowHash[$cell.Start.row]=1 }
|
||||
if ($null -ne $cell.Value ) {$colHash[$cell.Start.Column] = 1; $rowHash[$cell.Start.row] = 1 }
|
||||
}
|
||||
$rows = ( $StartRow..$EndRow ).Where({$rowHash[$_]})
|
||||
$columns = ($StartColumn..$EndColumn).Where({$colHash[$_]})
|
||||
$rows = ( $StartRow..$EndRow ).Where( {$rowHash[$_]})
|
||||
$columns = ($StartColumn..$EndColumn).Where( {$colHash[$_]})
|
||||
}
|
||||
else {
|
||||
$Columns = $StartColumn..$EndColumn ; if ($StartColumn -gt $EndColumn) {Write-Warning -Message "Selecting columns $StartColumn to $EndColumn might give odd results."}
|
||||
if ($NoHeader) {$Rows = ( $StartRow)..$EndRow ; if ($StartRow -gt $EndRow) {Write-Warning -Message "Selecting rows $StartRow to $EndRow might give odd results."} }
|
||||
else {$Rows = (1 + $StartRow)..$EndRow ; if ($StartRow -ge $EndRow) {Write-Warning -Message "Selecting $StartRow as the header with data in $(1+$StartRow) to $EndRow might give odd results."}}
|
||||
}
|
||||
#endregion
|
||||
#region Create property names
|
||||
@@ -394,12 +408,13 @@ function Import-Excel {
|
||||
else {
|
||||
#region Create one object per row
|
||||
foreach ($R in $Rows) {
|
||||
Write-Verbose "Import row '$R'"
|
||||
#Disabled write-verbose for speed
|
||||
# Write-Verbose "Import row '$R'"
|
||||
$NewRow = [Ordered]@{}
|
||||
|
||||
foreach ($P in $PropertyNames) {
|
||||
$NewRow[$P.Value] = $Worksheet.Cells[$R, $P.Column].Value
|
||||
Write-Verbose "Import cell '$($Worksheet.Cells[$R, $P.Column].Address)' with property name '$($p.Value)' and value '$($Worksheet.Cells[$R, $P.Column].Value)'."
|
||||
$NewRow[$P.Value] = $Worksheet.Cells[$R, $P.Column].Value
|
||||
# Write-Verbose "Import cell '$($Worksheet.Cells[$R, $P.Column].Address)' with property name '$($p.Value)' and value '$($Worksheet.Cells[$R, $P.Column].Value)'."
|
||||
}
|
||||
|
||||
[PSCustomObject]$NewRow
|
||||
@@ -444,11 +459,11 @@ function ConvertFrom-ExcelSheet {
|
||||
[String]
|
||||
$OutputPath = '.\',
|
||||
[String]
|
||||
$SheetName="*",
|
||||
[ValidateSet('ASCII', 'BigEndianUniCode','Default','OEM','UniCode','UTF32','UTF7','UTF8')]
|
||||
$SheetName = "*",
|
||||
[ValidateSet('ASCII', 'BigEndianUniCode', 'Default', 'OEM', 'UniCode', 'UTF32', 'UTF7', 'UTF8')]
|
||||
[string]
|
||||
$Encoding = 'UTF8',
|
||||
[ValidateSet('.txt', '.log','.csv')]
|
||||
[ValidateSet('.txt', '.log', '.csv')]
|
||||
[string]
|
||||
$Extension = '.csv',
|
||||
[ValidateSet(';', ',')]
|
||||
@@ -457,7 +472,7 @@ function ConvertFrom-ExcelSheet {
|
||||
)
|
||||
|
||||
$Path = (Resolve-Path $Path).Path
|
||||
$stream = New-Object -TypeName System.IO.FileStream -ArgumentList $Path,"Open","Read","ReadWrite"
|
||||
$stream = New-Object -TypeName System.IO.FileStream -ArgumentList $Path, "Open", "Read", "ReadWrite"
|
||||
$xl = New-Object -TypeName OfficeOpenXml.ExcelPackage -ArgumentList $stream
|
||||
$workbook = $xl.Workbook
|
||||
|
||||
@@ -469,8 +484,7 @@ function ConvertFrom-ExcelSheet {
|
||||
$params.Remove('Extension')
|
||||
$params.NoTypeInformation = $true
|
||||
|
||||
Foreach ($sheet in $targetSheets)
|
||||
{
|
||||
Foreach ($sheet in $targetSheets) {
|
||||
Write-Verbose "Exporting sheet: $($sheet.Name)"
|
||||
|
||||
$params.Path = "$OutputPath\$($Sheet.Name)$Extension"
|
||||
@@ -484,18 +498,18 @@ function ConvertFrom-ExcelSheet {
|
||||
}
|
||||
|
||||
function Export-MultipleExcelSheets {
|
||||
[Diagnostics.CodeAnalysis.SuppressMessageAttribute("PSAvoidUsingPlainTextForPassword","")]
|
||||
[Diagnostics.CodeAnalysis.SuppressMessageAttribute("PSAvoidUsingPlainTextForPassword", "")]
|
||||
param(
|
||||
[Parameter(Mandatory=$true)]
|
||||
[Parameter(Mandatory = $true)]
|
||||
$Path,
|
||||
[Parameter(Mandatory=$true)]
|
||||
[Parameter(Mandatory = $true)]
|
||||
[hashtable]$InfoMap,
|
||||
[string]$Password,
|
||||
[Switch]$Show,
|
||||
[Switch]$AutoSize
|
||||
)
|
||||
|
||||
$parameters = @{}+$PSBoundParameters
|
||||
$parameters = @{} + $PSBoundParameters
|
||||
$parameters.Remove("InfoMap")
|
||||
$parameters.Remove("Show")
|
||||
|
||||
@@ -503,24 +517,24 @@ function Export-MultipleExcelSheets {
|
||||
|
||||
foreach ($entry in $InfoMap.GetEnumerator()) {
|
||||
Write-Progress -Activity "Exporting" -Status "$($entry.Key)"
|
||||
$parameters.WorkSheetname=$entry.Key
|
||||
$parameters.WorkSheetname = $entry.Key
|
||||
|
||||
& $entry.Value | Export-Excel @parameters
|
||||
}
|
||||
|
||||
if($Show) {Invoke-Item $Path}
|
||||
if ($Show) {Invoke-Item $Path}
|
||||
}
|
||||
|
||||
Function WorksheetArgumentCompleter {
|
||||
param($commandName, $parameterName, $wordToComplete, $commandAst, $fakeBoundParameter)
|
||||
$xlPath = $fakeBoundParameter['Path']
|
||||
$xlPath = $fakeBoundParameter['Path']
|
||||
if (Test-Path -Path $xlPath) {
|
||||
$xlpkg = Open-ExcelPackage -Path $xlPath
|
||||
$WorksheetNames = $xlPkg.Workbook.Worksheets.Name
|
||||
Close-ExcelPackage -nosave -ExcelPackage $xlpkg
|
||||
$WorksheetNames.where({$_ -like "*$wordToComplete*"}) | foreach-object {
|
||||
$WorksheetNames.where( {$_ -like "*$wordToComplete*"}) | foreach-object {
|
||||
New-Object -TypeName System.Management.Automation.CompletionResult -ArgumentList "'$_'",
|
||||
$_ , ([System.Management.Automation.CompletionResultType]::ParameterValue) ,$_
|
||||
$_ , ([System.Management.Automation.CompletionResultType]::ParameterValue) , $_
|
||||
}
|
||||
}
|
||||
}
|
||||
|
||||
@@ -3,10 +3,13 @@
|
||||
.SYNOPSIS
|
||||
Combines data on all the sheets in an Excel worksheet onto a single sheet.
|
||||
.DESCRIPTION
|
||||
Join worksheet can work in two main ways:
|
||||
Either Combining data which has the same layout from many pages into one, or combining pages which have nothing in common.
|
||||
In the former case the header row is copied from the first sheet and, by default, each row of data is labelled with the name of the sheet it came from.
|
||||
In the latter case -NoHeader is specified, and each copied block can have the sheet it came from placed above it as a title.
|
||||
Join-Worksheet can work in two main ways, either
|
||||
Combining data which has the same layout from many pages into one, or
|
||||
combining pages which have nothing in common.
|
||||
In the former case the header row is copied from the first sheet and,
|
||||
by default, each row of data is labelled with the name of the sheet it came from.
|
||||
In the latter case -NoHeader is specified, and each copied block can have the
|
||||
sheet it came from placed above it as a title.
|
||||
.EXAMPLE
|
||||
>
|
||||
PS> foreach ($computerName in @('Server1', 'Server2', 'Server3', 'Server4')) {
|
||||
@@ -16,11 +19,15 @@
|
||||
PS> $ptDef =New-PivotTableDefinition -PivotTableName "Pivot1" -SourceWorkSheet "Combined" -PivotRows "Status" -PivotFilter "MachineName" -PivotData @{Status='Count'} -IncludePivotChart -ChartType BarClustered3D
|
||||
PS> Join-Worksheet -Path .\test.xlsx -WorkSheetName combined -FromLabel "MachineName" -HideSource -AutoSize -FreezeTopRow -BoldTopRow -PivotTableDefinition $pt -Show
|
||||
|
||||
The foreach command gets the services running on four servers and exports each to its own page in Test.xlsx.
|
||||
$PtDef= creates a defintion for a PivotTable.
|
||||
The Join-Worksheet command uses the same file and merges the results onto a sheet named "Combined". It sets a column header of "Machinename",
|
||||
this column will contain the name of the sheet the data was copied from; after copying the data to the sheet "combined", the other sheets will be hidden.
|
||||
Join-Worksheet finishes by calling Export-Excel to AutoSize cells, freeze the top row and make it bold and add the Pivot table.
|
||||
The foreach command gets the services running on four servers and exports each
|
||||
to its own page in Test.xlsx.
|
||||
$PtDef= creates a definition for a PivotTable.
|
||||
The Join-Worksheet command uses the same file and merges the results into a sheet
|
||||
named "Combined". It sets a column header of "Machinename", this column will
|
||||
contain the name of the sheet the data was copied from; after copying the data
|
||||
to the sheet "Combined", the other sheets will be hidden.
|
||||
Join-Worksheet finishes by calling Export-Excel to AutoSize cells, freeze the
|
||||
top row and make it bold and add thePivotTable.
|
||||
|
||||
.EXAMPLE
|
||||
>
|
||||
@@ -30,10 +37,14 @@
|
||||
Export-Excel -Path "$env:COMPUTERNAME.xlsx" -WorkSheetname NetAdapter
|
||||
PS> Join-Worksheet -Path "$env:COMPUTERNAME.xlsx" -WorkSheetName Summary -Title "Summary" -TitleBold -TitleSize 22 -NoHeader -LabelBlocks -AutoSize -HideSource -show
|
||||
|
||||
The first two commands get logical disk and network card information; each type is exported to its own sheet in a workbook.
|
||||
The Join-Worksheet command copies both onto a page named "Summary". Because the data is disimilar -NoHeader is specified, ensuring the whole of each page is copied.
|
||||
Specifying -LabelBlocks causes each sheet's name to become a title on the summary page above the copied data.
|
||||
The source data is hidden, a title is added in 22 point boldface and the columns are sized to fit the data.
|
||||
The first two commands get logical-disk and network-card information; each type
|
||||
is exported to its own sheet in a workbook.
|
||||
The Join-Worksheet command copies both onto a page named "Summary". Because
|
||||
the data is dissimilar, -NoHeader is specified, ensuring the whole of each
|
||||
page is copied. Specifying -LabelBlocks causes each sheet's name to become
|
||||
a title on the summary page above the copied data. The source data is
|
||||
hidden, a title is added in 22 point boldface and the columns are sized
|
||||
to fit the data.
|
||||
#>
|
||||
[CmdletBinding(DefaultParameterSetName = 'Default')]
|
||||
param (
|
||||
@@ -41,21 +52,21 @@
|
||||
[Parameter(ParameterSetName = "Default", Position = 0)]
|
||||
[Parameter(ParameterSetName = "Table" , Position = 0)]
|
||||
[String]$Path ,
|
||||
# An object representing an Excel Package - usually this is returned by specifying -Passthru allowing multiple commands to work on the same Workbook without saving and reloading each time.
|
||||
# An object representing an Excel Package - either from Open-Excel Package or specifying -PassThru to Export-Excel.
|
||||
[Parameter(Mandatory = $true, ParameterSetName = "PackageDefault")]
|
||||
[Parameter(Mandatory = $true, ParameterSetName = "PackageTable")]
|
||||
[OfficeOpenXml.ExcelPackage]$ExcelPackage,
|
||||
# The name of a sheet within the workbook where the other sheets will be joined together - "Combined" by default.
|
||||
$WorkSheetName = 'Combined',
|
||||
# If specified any pre-existing target for the joined data will be deleted and re-created; otherwise data will be appended on this sheet.
|
||||
# If specified ,any pre-existing target for the joined data will be deleted and re-created; otherwise data will be appended on this sheet.
|
||||
[switch]$Clearsheet,
|
||||
#Join-Worksheet assumes each sheet has identical headers and the headers should be copied to the target sheet, unless -NoHeader is specified.
|
||||
[switch]$NoHeader,
|
||||
#If -NoHeader is NOT specified, then rows of data will be labeled with the name of the sheet they came, FromLabel is the header for this column. If it is null or empty, the labels will be omitted.
|
||||
$FromLabel = "From" ,
|
||||
#If -NoHeader is NOT specified, then rows of data will be labeled with the name of the sheet they came from. FromLabel is the header for this column. If it is null or empty, the labels will be omitted.
|
||||
[string]$FromLabel = "From" ,
|
||||
#If specified, the copied blocks of data will have the name of the sheet they were copied from inserted above them as a title.
|
||||
[switch]$LabelBlocks,
|
||||
#Sizes the width of the Excel column to the maximum width needed to display all the containing data in that cell.
|
||||
#Sets the width of the Excel columns to display all the data in their cells.
|
||||
[Switch]$AutoSize,
|
||||
#Freezes headers etc. in the top row.
|
||||
[Switch]$FreezeTopRow,
|
||||
@@ -65,25 +76,25 @@
|
||||
[Switch]$FreezeTopRowFirstColumn,
|
||||
# Freezes panes at specified coordinates (in the form RowNumber , ColumnNumber).
|
||||
[Int[]]$FreezePane,
|
||||
#Enables the 'Filter' in Excel on the complete header row. So users can easily sort, filter and/or search the data in the select column from within Excel.
|
||||
#Enables the Excel filter on the headers of the combined sheet.
|
||||
[Parameter(ParameterSetName = 'Default')]
|
||||
[Parameter(ParameterSetName = 'PackageDefault')]
|
||||
[Switch]$AutoFilter,
|
||||
#Makes the top Row boldface.
|
||||
#Makes the top row boldface.
|
||||
[Switch]$BoldTopRow,
|
||||
#If Specified hides the sheets that the data is copied from.
|
||||
#If specified, hides the sheets that the data is copied from.
|
||||
[switch]$HideSource,
|
||||
#Text of a title to be placed in Cell A1.
|
||||
[String]$Title,
|
||||
#Sets the fill pattern for the title cell.
|
||||
[OfficeOpenXml.Style.ExcelFillStyle]$TitleFillPattern = 'Solid',
|
||||
#Sets the cell background color for the title cell.
|
||||
[System.Drawing.Color]$TitleBackgroundColor,
|
||||
$TitleBackgroundColor,
|
||||
#Sets the title in boldface type.
|
||||
[Switch]$TitleBold,
|
||||
#Sets the point size for the title.
|
||||
[Int]$TitleSize = 22,
|
||||
#Hashtable(s) with Sheet PivotRows, PivotColumns, PivotData, IncludePivotChart and ChartType values to specify a definition for one or more pivot table(s).
|
||||
#Hashtable(s) with Sheet PivotRows, PivotColumns, PivotData, IncludePivotChart and ChartType values to specify a definition for one or morePivotTable(s).
|
||||
[Hashtable]$PivotTableDefinition,
|
||||
#A hashtable containing ChartType, Title, NoLegend, ShowCategory, ShowPercent, Yrange, Xrange and SeriesHeader for one or more [non-pivot] charts.
|
||||
[Object[]]$ExcelChartDefinition,
|
||||
@@ -107,13 +118,13 @@
|
||||
})]
|
||||
[Parameter(ParameterSetName = 'Table' , Mandatory = $true)]
|
||||
[Parameter(ParameterSetName = 'PackageTable' , Mandatory = $true)]
|
||||
# Makes the data in the worksheet a table with a name applies a style to it. Name must not contain spaces.
|
||||
# Makes the data in the worksheet a table with a name and applies a style to it. Name must not contain spaces.
|
||||
[String]$TableName,
|
||||
[Parameter(ParameterSetName = 'Table')]
|
||||
[Parameter(ParameterSetName = 'PackageTable')]
|
||||
#Selects the style for the named table - defaults to 'Medium6'.
|
||||
#Selects the style for the named table - defaults to "Medium6".
|
||||
[OfficeOpenXml.Table.TableStyles]$TableStyle = 'Medium6',
|
||||
#Selects the style for the named table - defaults to 'Medium6'.
|
||||
#If specified, returns the range of cells in the combined sheet, in the format "A1:Z100".
|
||||
[switch]$ReturnRange,
|
||||
#Opens the Excel file immediately after creation. Convenient for viewing the results instantly without having to search for the file first.
|
||||
[switch]$Show,
|
||||
@@ -138,6 +149,7 @@
|
||||
if ($TitleBold) {$destinationSheet.Cells[1, 1].Style.Font.Bold = $True }
|
||||
#Can only set TitleBackgroundColor if TitleFillPattern is something other than None.
|
||||
if ($TitleBackgroundColor -AND ($TitleFillPattern -ne 'None')) {
|
||||
if ($TitleBackgroundColor -is [string]) {$TitleBackgroundColor = [System.Drawing.Color]::$TitleBackgroundColor }
|
||||
$destinationSheet.Cells[1, 1].Style.Fill.PatternType = $TitleFillPattern
|
||||
$destinationSheet.Cells[1, 1].Style.Fill.BackgroundColor.SetColor($TitleBackgroundColor)
|
||||
}
|
||||
@@ -149,6 +161,7 @@
|
||||
#Assume every row has titles in row 1, copy row 1 from first sheet to new sheet.
|
||||
$destinationSheet.Select("A$row")
|
||||
$ExcelPackage.Workbook.Worksheets[1].cells["1:1"].Copy($destinationSheet.SelectedRange)
|
||||
#fromlabel can't be an empty string
|
||||
if ($FromLabel ) {
|
||||
#Add a column which says where the data comes from.
|
||||
$fromColumn = ($destinationSheet.Dimension.Columns + 1)
|
||||
|
||||
@@ -1,84 +1,103 @@
|
||||
Function Merge-Worksheet {
|
||||
<#
|
||||
.Synopsis
|
||||
Merges two worksheets (or other objects) into a single worksheet with differences marked up.
|
||||
Merges two Worksheets (or other objects) into a single Worksheet with differences marked up.
|
||||
.Description
|
||||
The Compare-Worksheet command takes two worksheets and marks differences in the source document, and optionally outputs a grid showing the changes.
|
||||
By contrast the Merge-Worksheet command takes the worksheets and combines them into a single sheet showing the old and new data side by side .
|
||||
Although it is designed to work with Excel data it can work with arrays of any kind of object; so it can be a merge *of* worksheets, or a merge *to* worksheet.
|
||||
The Compare-Worksheet command takes two Worksheets and marks differences in the source document, and optionally outputs a grid showing the changes.
|
||||
By contrast the Merge-Worksheet command takes the Worksheets and combines them into a single sheet showing the old and new data side by side.
|
||||
Although it is designed to work with Excel data it can work with arrays of any kind of object; so it can be a merge *of* Worksheets, or a merge *to* a Worksheet.
|
||||
.Example
|
||||
merge-worksheet "Server54.xlsx" "Server55.xlsx" -WorkSheetName services -OutputFile Services.xlsx -OutputSheetName 54-55 -show
|
||||
The workbooks contain audit information for two servers, one page contains a list of services. This command creates a worksheet named 54-55
|
||||
in a workbook named services which shows all the services and their differences, and opens it in Excel.
|
||||
Merge-Worksheet "Server54.xlsx" "Server55.xlsx" -WorksheetName services -OutputFile Services.xlsx -OutputSheetName 54-55 -show
|
||||
The workbooks contain audit information for two servers, one sheet contains
|
||||
a list of services. This command creates a worksheet named "54-55" in a
|
||||
workbook named "services.xlsx" which shows all the services and their
|
||||
differences, and opens the new workbook in Excel.
|
||||
.Example
|
||||
merge-worksheet "Server54.xlsx" "Server55.xlsx" -WorkSheetName services -OutputFile Services.xlsx -OutputSheetName 54-55 -HideEqual -AddBackgroundColor LightBlue -show
|
||||
This modifies the previous command to hide the equal rows in the output sheet and changes the color used to mark rows added to the second file.
|
||||
Merge-Worksheet "Server54.xlsx" "Server55.xlsx" -WorksheetName services -OutputFile Services.xlsx -OutputSheetName 54-55 -HideEqual -AddBackgroundColor LightBlue -show
|
||||
This modifies the previous command to hide the equal rows in the output
|
||||
sheet and changes the color used to mark rows added to the second file.
|
||||
.Example
|
||||
merge-worksheet -OutputFile .\j1.xlsx -OutputSheetName test11 -ReferenceObject (dir .\ImportExcel\4.0.7) -DifferenceObject (dir .\ImportExcel\4.0.8) -Property Length -Show
|
||||
Merge-Worksheet -OutputFile .\j1.xlsx -OutputSheetName test11 -ReferenceObject (dir .\ImportExcel\4.0.7) -DifferenceObject (dir .\ImportExcel\4.0.8) -Property Length -Show
|
||||
This version compares two directories, and marks what has changed.
|
||||
Because no "Key" property is given, "Name" is assumed to be the key and the only other property examined is length.
|
||||
Files which are added or deleted or have changed size will be highlighed in the output sheet. Changes to dates or other attributes will be ignored.
|
||||
Because no "Key" property is given, "Name" is assumed to be the key
|
||||
and the only other property examined is length. Files which are added
|
||||
or deleted or have changed size will be highlighed in the output sheet.
|
||||
Changes to dates or other attributes will be ignored.
|
||||
.Example
|
||||
merge-worksheet -RefO (dir .\ImportExcel\4.0.7) -DiffO (dir .\ImportExcel\4.0.8) -Pr Length | Out-GridView
|
||||
This time no file is written and the results -which include all properties, not just length, are output and sent to Out-Gridview.
|
||||
This version uses aliases to shorten the parameters,
|
||||
(OutputFileName can be "outFile" and the sheet "OutSheet" : DifferenceObject & ReferenceObject can be DiffObject & RefObject).
|
||||
Merge-Worksheet -RefO (dir .\ImportExcel\4.0.7) -DiffO (dir .\ImportExcel\4.0.8) -Pr Length | Out-GridView
|
||||
This time no file is written and the results - which include all properties,
|
||||
not just length, are output and sent to Out-Gridview. This version uses
|
||||
aliases to shorten the parameters, (OutputFileName can be "outFile" and
|
||||
the Sheet can be"OutSheet"; DifferenceObject & ReferenceObject can be
|
||||
DiffObject & RefObject respectively).
|
||||
#>
|
||||
[cmdletbinding(SupportsShouldProcess=$true)]
|
||||
Param(
|
||||
#First Excel file to compare. You can compare two Excel files or two other objects but not one of each.
|
||||
[parameter(ParameterSetName='A',Mandatory=$true,Position=0)]
|
||||
[parameter(ParameterSetName='B',Mandatory=$true,Position=0)]
|
||||
[parameter(ParameterSetName='C',Mandatory=$true,Position=0)]
|
||||
#First Excel file to compare. You can compare two Excel files or two other objects or a reference obhct against a difference file, but not a reference file against an object.
|
||||
[parameter(ParameterSetName='A',Mandatory=$true,Position=0)] #A = Compare two files default headers
|
||||
[parameter(ParameterSetName='B',Mandatory=$true,Position=0)] #B = Compare two files user supplied headers
|
||||
[parameter(ParameterSetName='C',Mandatory=$true,Position=0)] #C = Compare two files headers P1, P2, P3 etc
|
||||
$Referencefile ,
|
||||
|
||||
#Second Excel file to compare.
|
||||
[parameter(ParameterSetName='A',Mandatory=$true,Position=1)]
|
||||
[parameter(ParameterSetName='B',Mandatory=$true,Position=1)]
|
||||
[parameter(ParameterSetName='C',Mandatory=$true,Position=1)]
|
||||
[parameter(ParameterSetName='E',Mandatory=$true,Position=1)]
|
||||
[parameter(ParameterSetName='E',Mandatory=$true,Position=1)] #D Compare two objects; E = Compare one object one file that uses default headers
|
||||
[parameter(ParameterSetName='F',Mandatory=$true,Position=1)] #F = Compare one object one file that uses user supplied headers
|
||||
[parameter(ParameterSetName='G',Mandatory=$true,Position=1)] #G Compare one object one file that uses headers P1, P2, P3 etc
|
||||
$Differencefile ,
|
||||
|
||||
#Name(s) of worksheets to compare,
|
||||
[parameter(ParameterSetName='A',Position=2)]
|
||||
#Name(s) of Worksheets to compare.
|
||||
[parameter(ParameterSetName='A',Position=2)] #Applies to all sets EXCEPT D which is two objects (no sheets)
|
||||
[parameter(ParameterSetName='B',Position=2)]
|
||||
[parameter(ParameterSetName='C',Position=2)]
|
||||
[parameter(ParameterSetName='E',Position=2)]
|
||||
$WorkSheetName = "Sheet1",
|
||||
[parameter(ParameterSetName='F',Position=2)]
|
||||
[parameter(ParameterSetName='G',Position=2)]
|
||||
$WorksheetName = "Sheet1",
|
||||
|
||||
#The row from where we start to import data, all rows above the StartRow are disregarded. By default this is the first row.
|
||||
[parameter(ParameterSetName='A')]
|
||||
[parameter(ParameterSetName='A')] #Applies to all sets EXCEPT D which is two objects (no sheets, so no start row )
|
||||
[parameter(ParameterSetName='B')]
|
||||
[parameter(ParameterSetName='C')]
|
||||
[parameter(ParameterSetName='E')]
|
||||
[parameter(ParameterSetName='F')]
|
||||
[parameter(ParameterSetName='G')]
|
||||
[int]$Startrow = 1,
|
||||
|
||||
#Specifies custom property names to use, instead of the values defined in the column headers of the TopRow.
|
||||
[Parameter(ParameterSetName='B',Mandatory=$true)]
|
||||
#Specifies custom property names to use, instead of the values defined in the column headers of the Start ROw.
|
||||
[Parameter(ParameterSetName='B',Mandatory=$true)] #Compare object + sheet or 2 sheets with user supplied headers
|
||||
[Parameter(ParameterSetName='F',Mandatory=$true)]
|
||||
[String[]]$Headername,
|
||||
|
||||
#Automatically generate property names (P1, P2, P3, ..) instead of the using the values the top row of the sheet.
|
||||
[Parameter(ParameterSetName='C',Mandatory=$true)]
|
||||
#Automatically generate property names (P1, P2, P3, ..) instead of using the values the top row of the sheet.
|
||||
[Parameter(ParameterSetName='C',Mandatory=$true)] #Compare object + sheet or 2 sheets with headers of P1, P2, P3 ...
|
||||
[Parameter(ParameterSetName='G',Mandatory=$true)]
|
||||
[switch]$NoHeader,
|
||||
|
||||
#Object to compare if a worksheet is NOT being used.
|
||||
#Reference object to compare if a Worksheet is NOT being used. Reference object can combine with a difference sheet or difference object
|
||||
[parameter(ParameterSetName='D',Mandatory=$true)]
|
||||
[parameter(ParameterSetName='E',Mandatory=$true)]
|
||||
[parameter(ParameterSetName='F',Mandatory=$true)]
|
||||
[parameter(ParameterSetName='G',Mandatory=$true)]
|
||||
[Alias('RefObject')]
|
||||
$ReferenceObject ,
|
||||
#Object to compare if a worksheet is NOT being used.
|
||||
#Difference object to compare if a Worksheet is NOT being used for either half. Can't have a reference sheet and difference object.
|
||||
[parameter(ParameterSetName='D',Mandatory=$true,Position=1)]
|
||||
[Alias('DiffObject')]
|
||||
$DifferenceObject ,
|
||||
[parameter(ParameterSetName='D',Position=2)]
|
||||
[parameter(ParameterSetName='E',Position=3)]
|
||||
[parameter(ParameterSetName='E',Position=2)]
|
||||
[parameter(ParameterSetName='F',Position=2)]
|
||||
[parameter(ParameterSetName='G',Position=2)]
|
||||
#If there isn't a filename to use to label data from the "Difference" side, DiffPrefix is used, it defaults to "=>"
|
||||
$DiffPrefix = "=>" ,
|
||||
#File to hold merged data.
|
||||
[parameter(Position=3)]
|
||||
[Alias('OutFile')]
|
||||
$OutputFile ,
|
||||
#Name of worksheet to output - if none specified will use the reference worksheet name.
|
||||
#Name of Worksheet to output - if none specified will use the reference Worksheet name.
|
||||
[parameter(Position=4)]
|
||||
[Alias('OutSheet')]
|
||||
$OutputSheetName = "Sheet1",
|
||||
@@ -89,51 +108,54 @@
|
||||
#Name of a column which is unique used to pair up rows from the refence and difference side, default is "Name".
|
||||
$Key = "Name" ,
|
||||
#Sets the font color for the "key" field; this means you can filter by color to get only changed rows.
|
||||
[System.Drawing.Color]$KeyFontColor = "DarkRed",
|
||||
$KeyFontColor = [System.Drawing.Color]::DarkRed ,
|
||||
#Sets the background color for changed rows.
|
||||
[System.Drawing.Color]$ChangeBackgroundColor = "Orange",
|
||||
$ChangeBackgroundColor = [System.Drawing.Color]::Orange,
|
||||
#Sets the background color for rows in the reference but deleted from the difference sheet.
|
||||
[System.Drawing.Color]$DeleteBackgroundColor = "LightPink",
|
||||
$DeleteBackgroundColor = [System.Drawing.Color]::LightPink,
|
||||
#Sets the background color for rows not in the reference but added to the difference sheet.
|
||||
[System.Drawing.Color]$AddBackgroundColor = "PaleGreen",
|
||||
#if Specified hides the rows in the spreadsheet that are equal and only shows changes, added or deleted rows.
|
||||
$AddBackgroundColor = [System.Drawing.Color]::PaleGreen,
|
||||
#if specified, hides the rows in the spreadsheet that are equal and only shows changes, added or deleted rows.
|
||||
[switch]$HideEqual ,
|
||||
#If specified outputs the data to the pipeline (you can add -whatif so it the command only outputs to the pipeline).
|
||||
#If specified, outputs the data to the pipeline (you can add -WhatIf so the command only outputs to the pipeline).
|
||||
[switch]$Passthru ,
|
||||
#If specified, opens the output workbook.
|
||||
[Switch]$Show
|
||||
)
|
||||
|
||||
#region Read Excel data
|
||||
if ($Referencefile -and $Differencefile) {
|
||||
if ($Differencefile -is [System.IO.FileInfo]) {$Differencefile = $Differencefile.FullName}
|
||||
if ($Referencefile -is [System.IO.FileInfo]) {$Referencefile = $Referencefile.FullName}
|
||||
if ($Referencefile -and $Differencefile) {
|
||||
#if the filenames don't resolve, give up now.
|
||||
try { $oneFile = ((Resolve-Path -Path $Referencefile -ErrorAction Stop).path -eq (Resolve-Path -Path $Differencefile -ErrorAction Stop).path)}
|
||||
Catch { Write-Warning -Message "Could not Resolve the filenames." ; return }
|
||||
|
||||
#If we have one file , we must have two different worksheet names. If we have two files $worksheetName can be a single string or two strings.
|
||||
if ($onefile -and ( ($WorkSheetName.count -ne 2) -or $WorkSheetName[0] -eq $WorkSheetName[1] ) ) {
|
||||
Write-Warning -Message "If both the Reference and difference file are the same then worksheet name must provide 2 different names"
|
||||
#If we have one file , we must have two different Worksheet names. If we have two files $WorksheetName can be a single string or two strings.
|
||||
if ($onefile -and ( ($WorksheetName.count -ne 2) -or $WorksheetName[0] -eq $WorksheetName[1] ) ) {
|
||||
Write-Warning -Message "If both the Reference and difference file are the same then Worksheet name must provide 2 different names"
|
||||
return
|
||||
}
|
||||
if ($WorkSheetName.count -eq 2) {$workSheet2 = $DiffPrefix = $WorkSheetName[1] ; $worksheet1 = $WorkSheetName[0] ; }
|
||||
elseif ($WorkSheetName -is [string]) {$worksheet2 = $workSheet1 = $WorkSheetName ;
|
||||
if ($WorksheetName.count -eq 2) {$Worksheet2 = $DiffPrefix = $WorksheetName[1] ; $Worksheet1 = $WorksheetName[0] ; }
|
||||
elseif ($WorksheetName -is [string]) {$Worksheet2 = $Worksheet1 = $WorksheetName ;
|
||||
$DiffPrefix = (Split-Path -Path $Differencefile -Leaf) -replace "\.xlsx$","" }
|
||||
else {Write-Warning -Message "You must provide either a single worksheet name or two names." ; return }
|
||||
else {Write-Warning -Message "You must provide either a single Worksheet name or two names." ; return }
|
||||
|
||||
$params= @{ ErrorAction = [System.Management.Automation.ActionPreference]::Stop }
|
||||
foreach ($p in @("HeaderName","NoHeader","StartRow")) {if ($PSBoundParameters[$p]) {$params[$p] = $PSBoundParameters[$p]}}
|
||||
try {
|
||||
$ReferenceObject = Import-Excel -Path $Referencefile -WorksheetName $WorkSheet1 @params
|
||||
$DifferenceObject = Import-Excel -Path $Differencefile -WorksheetName $WorkSheet2 @Params
|
||||
$ReferenceObject = Import-Excel -Path $Referencefile -WorksheetName $Worksheet1 @params
|
||||
$DifferenceObject = Import-Excel -Path $Differencefile -WorksheetName $Worksheet2 @Params
|
||||
}
|
||||
Catch {Write-Warning -Message "Could not read the worksheet from $Referencefile::$worksheet1 and/or $Differencefile::$worksheet2." ; return }
|
||||
Catch {Write-Warning -Message "Could not read the Worksheet from $Referencefile::$Worksheet1 and/or $Differencefile::$Worksheet2." ; return }
|
||||
if ($NoHeader) {$firstDataRow = $Startrow } else {$firstDataRow = $Startrow + 1}
|
||||
}
|
||||
elseif ( $Differencefile) {
|
||||
if ($WorkSheetName -isnot [string]) {Write-Warning -Message "You must provide a single worksheet name." ; return }
|
||||
$params = @{WorkSheetName=$WorkSheetName; Path=$Differencefile; ErrorAction = [System.Management.Automation.ActionPreference]::Stop ;}
|
||||
if ($WorksheetName -isnot [string]) {Write-Warning -Message "You must provide a single Worksheet name." ; return }
|
||||
$params = @{WorksheetName=$WorksheetName; Path=$Differencefile; ErrorAction=[System.Management.Automation.ActionPreference]::Stop }
|
||||
foreach ($p in @("HeaderName","NoHeader","StartRow")) {if ($PSBoundParameters[$p]) {$params[$p] = $PSBoundParameters[$p]}}
|
||||
try {$DifferenceObject = Import-Excel @Params }
|
||||
Catch {Write-Warning -Message "Could not read the worksheet '$WorkSheetName' from $Differencefile::$WorkSheetName." ; return }
|
||||
Catch {Write-Warning -Message "Could not read the Worksheet '$WorksheetName' from $Differencefile::$WorksheetName." ; return }
|
||||
if ($DiffPrefix -eq "=>" ) {
|
||||
$DiffPrefix = (Split-Path -Path $Differencefile -Leaf) -replace "\.xlsx$",""
|
||||
}
|
||||
@@ -149,7 +171,7 @@
|
||||
$headings = $DifferenceObject[0].psobject.Properties.Name # This preserves the sequence - using get-member would sort them alphabetically! There may be extra properties in
|
||||
if ($NoHeader -and "Name" -eq $Key) {$Key = "p1"}
|
||||
if ($headings -notcontains $Key -and
|
||||
('*' -ne $Key)) {Write-Warning -Message "You need to specify one of the headings in the sheet '$worksheet1' as a key." ; return }
|
||||
('*' -ne $Key)) {Write-Warning -Message "You need to specify one of the headings in the sheet '$Worksheet1' as a key." ; return }
|
||||
foreach ($p in $Property) { $propList += ($headings.where({$_ -like $p}) )}
|
||||
foreach ($p in $ExcludeProperty) { $propList = $propList.where({$_ -notlike $p}) }
|
||||
if (($propList -notcontains $Key) -and
|
||||
@@ -199,19 +221,29 @@
|
||||
else {$Rowhash[$row.$key] = $rowNo }
|
||||
$rowNo ++
|
||||
}
|
||||
if ($DifferenceObject.count -gt $Rowhash.Keys.Count) {
|
||||
Write-Warning -Message "Difference object has $($DifferenceObject.Count) rows; but only $($Rowhash.keys.count) unique keys"
|
||||
}
|
||||
if ($Key -eq '*') {$key = "_ALL"}
|
||||
#endregion
|
||||
#We need to know all the properties we've met on the objects we've diffed
|
||||
$eDiffProps = [ordered]@{}
|
||||
#When we do a compare object changes will result in two rows so we group them and join them together.
|
||||
$expandedDiff = Compare-Object -ReferenceObject $ReferenceObject -DifferenceObject $DifferenceObject -Property $propList -PassThru -IncludeEqual |
|
||||
Group-Object -Property $key | ForEach-Object {
|
||||
#The value of the key column is the name of the group.
|
||||
#The value of the key column is the name of the Group.
|
||||
$keyval = $_.name
|
||||
#we're going to create a custom object from a hash table. ??Might no longer need to preserve the field order
|
||||
#we're going to create a custom object from a hash table.
|
||||
$hash = [ordered]@{}
|
||||
foreach ($result in $_.Group) {
|
||||
if ($result.SideIndicator -ne "=>") {$hash["_Row"] = $result._Row }
|
||||
elseif (-not $hash["$DiffPrefix Row"]) {$hash["_Row"] = "" }
|
||||
#if we have already set the side, be this must the second record, so set side to indicate "changed"
|
||||
if ($hash.Side) {$hash.Side = "<>"} else {$hash["Side"] = $result.SideIndicator}
|
||||
#if we have already set the side, this must be the second record, so set side to indicate "changed"; if we got two "Same" indicators we may have a classh of keys
|
||||
if ($hash.Side) {
|
||||
if ($hash.Side -eq $result.SideIndicator) {Write-Warning -Message "'$keyval' may be a duplicate."}
|
||||
$hash.Side = "<>"
|
||||
}
|
||||
else {$hash["Side"] = $result.SideIndicator}
|
||||
switch ($hash.side) {
|
||||
'==' { $hash["$DiffPrefix is"] = 'Same' }
|
||||
'=>' { $hash["$DiffPrefix is"] = 'Added' }
|
||||
@@ -224,7 +256,7 @@
|
||||
}
|
||||
'<=' { $hash["$DiffPrefix is"] = 'Removed'}
|
||||
}
|
||||
#find the number of the row in the the "difference" object which has this key. If it is the object is only the reference this will be blank.
|
||||
#find the number of the row in the the "difference" object which has this key. If it is the object is only in the reference this will be blank.
|
||||
$hash["$DiffPrefix Row"] = $Rowhash[$keyval]
|
||||
$hash[$key] = $keyval
|
||||
#Create FieldName and/or =>FieldName columns
|
||||
@@ -236,6 +268,8 @@
|
||||
elseif ($result.SideIndicator -eq "=>") { $hash[("$DiffPrefix $p")] = $result.$P}
|
||||
}
|
||||
}
|
||||
|
||||
foreach ($k in $hash.keys) {$eDiffProps[$k] = $true}
|
||||
[Pscustomobject]$hash
|
||||
} | Sort-Object -Property "_row"
|
||||
|
||||
@@ -246,35 +280,35 @@
|
||||
$expandedDiff = $expandedDiff | Sort-Object -Property "$DiffPrefix Row"
|
||||
for ($i = 1; $i -lt $expandedDiff.Count; $i++) {if (-not $expandedDiff[$i]."_Row") {$expandedDiff[$i]."_Row" = $expandedDiff[$i-1]."_Row" } }
|
||||
|
||||
$AllProps = @("_Row") + $OutputProps + $expandedDiff[0].psobject.properties.name.where({$_ -notin ($outputProps + @("_row","side","SideIndicator","_ALL" ))})
|
||||
$AllProps = @("_Row") + $OutputProps + $eDiffProps.keys.where({$_ -notin ($outputProps + @("_row","side","SideIndicator","_ALL" ))})
|
||||
|
||||
if ($PassThru -or -not $OutputFile) {return ($expandedDiff | Select-Object -Property $allprops | Sort-Object -Property "_row", "$DiffPrefix Row" | Update-FirstObjectProperties ) }
|
||||
if ($PassThru -or -not $OutputFile) {return ($expandedDiff | Select-Object -Property $allprops | Sort-Object -Property "_row", "$DiffPrefix Row" ) }
|
||||
elseif ($PSCmdlet.ShouldProcess($OutputFile,"Write Output to Excel file")) {
|
||||
$expandedDiff = $expandedDiff | Sort-Object -Property "_row", "$DiffPrefix Row"
|
||||
$xl = $expandedDiff | Select-Object -Property $OutputProps | Update-FirstObjectProperties |
|
||||
Export-Excel -Path $OutputFile -WorkSheetname $OutputSheetName -FreezeTopRow -BoldTopRow -AutoSize -AutoFilter -PassThru
|
||||
Export-Excel -Path $OutputFile -Worksheetname $OutputSheetName -FreezeTopRow -BoldTopRow -AutoSize -AutoFilter -PassThru
|
||||
$ws = $xl.Workbook.Worksheets[$OutputSheetName]
|
||||
for ($i = 0; $i -lt $expandedDiff.Count; $i++ ) {
|
||||
if ( $expandedDiff[$i].side -ne "==" ) {
|
||||
Set-ExcelRange -WorkSheet $ws -Range ("A" + ($i + 2 )) -FontColor $KeyFontColor
|
||||
Set-ExcelRange -Worksheet $ws -Range ("A" + ($i + 2 )) -FontColor $KeyFontColor
|
||||
}
|
||||
elseif ( $HideEqual ) {$ws.row($i+2).hidden = $true }
|
||||
if ( $expandedDiff[$i].side -eq "<>" ) {
|
||||
$range = $ws.Dimension -replace "\d+", ($i + 2 )
|
||||
Set-ExcelRange -WorkSheet $ws -Range $range -BackgroundColor $ChangeBackgroundColor
|
||||
Set-ExcelRange -Worksheet $ws -Range $range -BackgroundColor $ChangeBackgroundColor
|
||||
}
|
||||
elseif ( $expandedDiff[$i].side -eq "<=" ) {
|
||||
$rangeR1C1 = "R[{0}]C[1]:R[{0}]C[{1}]" -f ($i + 2 ) , $lastRefColNo
|
||||
$range = [OfficeOpenXml.ExcelAddress]::TranslateFromR1C1($rangeR1C1,0,0)
|
||||
Set-ExcelRange -WorkSheet $ws -Range $range -BackgroundColor $DeleteBackgroundColor
|
||||
Set-ExcelRange -Worksheet $ws -Range $range -BackgroundColor $DeleteBackgroundColor
|
||||
}
|
||||
elseif ( $expandedDiff[$i].side -eq "=>" ) {
|
||||
if ($propList.count -gt 1) {
|
||||
$rangeR1C1 = "R[{0}]C[{1}]:R[{0}]C[{2}]" -f ($i + 2 ) , $FirstDiffColNo , $lastDiffColNo
|
||||
$range = [OfficeOpenXml.ExcelAddress]::TranslateFromR1C1($rangeR1C1,0,0)
|
||||
Set-ExcelRange -WorkSheet $ws -Range $range -BackgroundColor $AddBackgroundColor
|
||||
Set-ExcelRange -Worksheet $ws -Range $range -BackgroundColor $AddBackgroundColor
|
||||
}
|
||||
Set-ExcelRange -WorkSheet $ws -Range ("A" + ($i + 2 )) -BackgroundColor $AddBackgroundColor
|
||||
Set-ExcelRange -Worksheet $ws -Range ("A" + ($i + 2 )) -BackgroundColor $AddBackgroundColor
|
||||
}
|
||||
}
|
||||
Close-ExcelPackage -ExcelPackage $xl -Show:$Show
|
||||
@@ -284,82 +318,102 @@
|
||||
Function Merge-MultipleSheets {
|
||||
<#
|
||||
.Synopsis
|
||||
Merges worksheets into a single worksheet with differences marked up.
|
||||
Merges Worksheets into a single Worksheet with differences marked up.
|
||||
.Description
|
||||
The Merge worksheet command combines 2 sheets. Merge-MultipleSheets is designed to merge more than 2.
|
||||
So if asked to merge sheets A,B,C which contain Services, with a Name, Displayname and Start mode, where "name" is treated as the key
|
||||
Merge-MultipleSheets calls Merge-Worksheet to merge Name, Displayname and Start mode, from sheets A and C
|
||||
the result has column headings -Row, Name, DisplayName, Startmode, C-DisplayName, C-StartMode C-Is, C-Row
|
||||
Merge-MultipleSheets then calls Merge-Worsheet with this result and sheet B, comparing 'Name', 'Displayname' and 'Start mode' columns on each side
|
||||
which outputs _Row, Name, DisplayName, Startmode, B-DisplayName, B-StartMode B-Is, B-Row, C-DisplayName, C-StartMode C-Is, C-Row
|
||||
Any columns in the "reference" side which are not used in the comparison are appended on the right, which is we compare the sheets in reverse order.
|
||||
The Merge Worksheet command combines two sheets. Merge-MultipleSheets is
|
||||
designed to merge more than two. So if asked to merge sheets A,B,C which
|
||||
contain Services, with a Name, Displayname and Start mode, where "Name" is
|
||||
treated as the key, Merge-MultipleSheets calls Merge-Worksheet to merge
|
||||
"Name", "Displayname" and "Startmode" from sheets A and C; the result has
|
||||
column headings "_Row", "Name", "DisplayName", "Startmode", "C-DisplayName",
|
||||
"C-StartMode", "C-Is" and "C-Row".
|
||||
Merge-MultipleSheets then calls Merge-Worksheet again passing it the
|
||||
intermediate result and sheet B, comparing "Name", "Displayname" and
|
||||
"Start mode" columns on each side, and gets a result with columns "_Row",
|
||||
"Name", "DisplayName", "Startmode", "B-DisplayName", "B-StartMode", "B-Is",
|
||||
"B-Row", "C-DisplayName", "C-StartMode", "C-Is" and "C-Row". Any columns on
|
||||
the "reference" side which are not used in the comparison are added on the
|
||||
right, which is why we compare the sheets in reverse order.
|
||||
|
||||
The "Is" column holds "Same", "Added", "Removed" or "Changed" and is used for conditional formatting in the output sheet (this is hidden by default),
|
||||
and when the data is written to Excel the "reference" columns, in this case "DisplayName" and "Start" are renamed to reflect their source,
|
||||
so become "A-DisplayName" and "A-Start".
|
||||
The "Is" columns hold "Same", "Added", "Removed" or "Changed" and is used for
|
||||
conditional formatting in the output sheet (these columns are hidden by default),
|
||||
and when the data is written to Excel the "reference" columns, in this case
|
||||
"DisplayName" and "Start" are renamed to reflect their source, so become
|
||||
"A-DisplayName" and "A-Start".
|
||||
|
||||
Conditional formatting is also applied to the "key" column (name in this case) so the view can be filtered to rows with changes by filtering this column on color.
|
||||
Conditional formatting is also applied to the Key column ("Name" in this
|
||||
case) so the view can be filtered to rows with changes by filtering this
|
||||
column on color.
|
||||
|
||||
Note: the processing order can affect what is seen as a change. For example if there is an extra item in sheet B in the example above,
|
||||
Sheet C will be processed and that row and will not be seen to be missing. When sheet B is processed it is marked as an addition, and the conditional formatting marks
|
||||
the entries from sheet A to show that a values were added in at least one sheet.
|
||||
However if Sheet B is the reference sheet, A and C will be seen to have an item removed;
|
||||
and if B is processed before C, the extra item is known when C is processed and so C is considered to be missing that item.
|
||||
Note: the processing order can affect what is seen as a change. For example
|
||||
if there is an extra item in sheet B in the example above, Sheet C will be
|
||||
processed and that row and will not be seen to be missing. When sheet B is
|
||||
processed it is marked as an addition, and the conditional formatting marks
|
||||
the entries from sheet A to show that a values were added in at least one
|
||||
sheet. However if Sheet B is the reference sheet, A and C will be seen to
|
||||
have an item removed; and if B is processed before C, the extra item is
|
||||
known when C is processed and so C is considered to be missing that item.
|
||||
.Example
|
||||
dir Server*.xlsx | Merge-MulipleSheets -WorkSheetName Services -OutputFile Test2.xlsx -OutputSheetName Services -Show
|
||||
We are auditing servers and each one has a workbook in the current directory which contains a "Services" worksheet (the result of
|
||||
Get-WmiObject -Class win32_service | Select-Object -Property Name, Displayname, Startmode
|
||||
No key is specified so the key is assumed to be the "Name" column. The files are merged and the result is opened on completion.
|
||||
dir Server*.xlsx | Merge-MulipleSheets -WorksheetName Services -OutputFile Test2.xlsx -OutputSheetName Services -Show
|
||||
Here we are auditing servers and each one has a workbook in the current
|
||||
directory which contains a "Services" Worksheet (the result of
|
||||
Get-WmiObject -Class win32_service | Select-Object -Property Name, Displayname, Startmode)
|
||||
No key is specified so the key is assumed to be the "Name" column.
|
||||
The files are merged and the result is opened on completion.
|
||||
.Example
|
||||
dir Serv*.xlsx | Merge-MulipleSheets -WorkSheetName Software -Key "*" -ExcludeProperty Install* -OutputFile Test2.xlsx -OutputSheetName Software -Show
|
||||
The server audit files in the previous example also have "Software" worksheet, but no single field on that sheet works as a key.
|
||||
Specifying "*" for the key produces a compound key using all non-excluded fields (and the installation date and file location are excluded).
|
||||
dir Serv*.xlsx | Merge-MulipleSheets -WorksheetName Software -Key "*" -ExcludeProperty Install* -OutputFile Test2.xlsx -OutputSheetName Software -Show
|
||||
The server audit files in the previous example also have "Software" worksheet,
|
||||
but no single field on that sheet works as a key. Specifying "*" for the key
|
||||
produces a compound key using all non-excluded fields (and the installation
|
||||
date and file location are excluded).
|
||||
.Example
|
||||
Merge-MulipleSheets -Path hotfixes.xlsx -WorkSheetName Serv* -Key hotfixid -OutputFile test2.xlsx -OutputSheetName hotfixes -HideRowNumbers -Show
|
||||
This time all the servers have written their hofix information to their own worksheets in a shared Excel workbook named "Hotfixes"
|
||||
(the information was obtained by running Get-Hotfix | Sort-Object -Property description,hotfixid | Select-Object -Property Description,HotfixID)
|
||||
This ignores any sheets which are not named "Serv*", and uses the HotfixID as the key ; in this version the row numbers are hidden.
|
||||
Merge-MulipleSheets -Path hotfixes.xlsx -WorksheetName Serv* -Key hotfixid -OutputFile test2.xlsx -OutputSheetName hotfixes -HideRowNumbers -Show
|
||||
This time all the servers have written their hotfix information to their own
|
||||
worksheets in a shared Excel workbook named "Hotfixes.xlsx" (the information was
|
||||
obtained by running Get-Hotfix | Sort-Object -Property description,hotfixid | Select-Object -Property Description,HotfixID)
|
||||
This ignores any sheets which are not named "Serv*", and uses the HotfixID as
|
||||
the key; in this version the row numbers are hidden.
|
||||
#>
|
||||
[cmdletbinding()]
|
||||
[Alias("Merge-MulipleSheets")]
|
||||
#[Alias("Merge-MulipleSheets")] #There was a spelling error in the first release. This was there to ensure things didn't break but intelisense gave the alias first.
|
||||
param (
|
||||
#Paths to the files to be merged.
|
||||
#Paths to the files to be merged. Files are also accepted
|
||||
[Parameter(Mandatory=$true,ValueFromPipeline=$true)]
|
||||
[string[]]$Path ,
|
||||
#The row from where we start to import data, all rows above the StartRow are disregarded. By default this is the first row.
|
||||
$Path ,
|
||||
#The row from where we start to import data, all rows above the Start row are disregarded. By default this is the first row.
|
||||
[int]$Startrow = 1,
|
||||
|
||||
#Specifies custom property names to use, instead of the values defined in the column headers of the TopRow.
|
||||
#Specifies custom property names to use, instead of the values defined in the column headers of the Start row.
|
||||
[String[]]$Headername,
|
||||
|
||||
#Automatically generate property names (P1, P2, P3, ..) instead of the using the values the top row of the sheet.
|
||||
#If specified, property names will be automatically generated (P1, P2, P3, ..) instead of using the values from the start row.
|
||||
[switch]$NoHeader,
|
||||
|
||||
#Name(s) of worksheets to compare,
|
||||
$WorkSheetName = "Sheet1",
|
||||
#File to write output to
|
||||
#Name(s) of Worksheets to compare.
|
||||
$WorksheetName = "Sheet1",
|
||||
#File to write output to.
|
||||
[Alias('OutFile')]
|
||||
$OutputFile = ".\temp.xlsx",
|
||||
#Name of worksheet to output - if none specified will use the reference worksheet name.
|
||||
#Name of Worksheet to output - if none specified will use the reference Worksheet name.
|
||||
[Alias('OutSheet')]
|
||||
$OutputSheetName = "Sheet1",
|
||||
#Properties to include in the DIFF - supports wildcards, default is "*".
|
||||
#Properties to include in the comparison - supports wildcards, default is "*".
|
||||
$Property = "*" ,
|
||||
#Properties to exclude from the the search - supports wildcards.
|
||||
#Properties to exclude from the the comparison - supports wildcards.
|
||||
$ExcludeProperty ,
|
||||
#Name of a column which is unique used to pair up rows from the refence and difference side, default is "Name".
|
||||
#Name of a column which is unique used to pair up rows from the reference and difference sides, default is "Name".
|
||||
$Key = "Name" ,
|
||||
#Sets the font color for the "key" field; this means you can filter by color to get only changed rows.
|
||||
[System.Drawing.Color]$KeyFontColor = "Red",
|
||||
#Sets the font color for the Key field; this means you can filter by color to get only changed rows.
|
||||
$KeyFontColor = [System.Drawing.Color]::Red,
|
||||
#Sets the background color for changed rows.
|
||||
[System.Drawing.Color]$ChangeBackgroundColor = "Orange",
|
||||
$ChangeBackgroundColor = [System.Drawing.Color]::Orange,
|
||||
#Sets the background color for rows in the reference but deleted from the difference sheet.
|
||||
[System.Drawing.Color]$DeleteBackgroundColor = "LightPink",
|
||||
$DeleteBackgroundColor = [System.Drawing.Color]::LightPink,
|
||||
#Sets the background color for rows not in the reference but added to the difference sheet.
|
||||
[System.Drawing.Color]$AddBackgroundColor = "Orange",
|
||||
#if Specified hides the columns in the spreadsheet that contain the row numbers
|
||||
$AddBackgroundColor = [System.Drawing.Color]::Orange,
|
||||
#If specified, hides the columns in the spreadsheet that contain the row numbers.
|
||||
[switch]$HideRowNumbers ,
|
||||
#If specified outputs the data to the pipeline (you can add -whatif so it the command only outputs to the command)
|
||||
#If specified, outputs the data to the pipeline (you can add -whatif so it the command only outputs to the pipeline).
|
||||
[switch]$Passthru ,
|
||||
#If specified, opens the output workbook.
|
||||
[Switch]$Show
|
||||
@@ -367,50 +421,51 @@ Function Merge-MultipleSheets {
|
||||
begin { $filestoProcess = @() }
|
||||
process { $filestoProcess += $Path}
|
||||
end {
|
||||
if ($filestoProcess.Count -eq 1 -and $WorkSheetName -match '\*') {
|
||||
if ($filestoProcess.Count -eq 1 -and $WorksheetName -match '\*') {
|
||||
Write-Progress -Activity "Merging sheets" -CurrentOperation "Expanding * to names of sheets in $($filestoProcess[0]). "
|
||||
$excel = Open-ExcelPackage -Path $filestoProcess
|
||||
$WorksheetName = $excel.Workbook.Worksheets.Name.where({$_ -like $WorkSheetName})
|
||||
$WorksheetName = $excel.Workbook.Worksheets.Name.where({$_ -like $WorksheetName})
|
||||
Close-ExcelPackage -NoSave -ExcelPackage $excel
|
||||
}
|
||||
|
||||
#Merge indentically named sheets in different work books;
|
||||
if ($filestoProcess.Count -ge 2 -and $WorkSheetName -is "string" ) {
|
||||
Get-Variable -Name 'HeaderName','NoHeader','StartRow','Key','Property','ExcludeProperty','WorkSheetName' -ErrorAction SilentlyContinue |
|
||||
#Merge identically named sheets in different work books;
|
||||
if ($filestoProcess.Count -ge 2 -and $WorksheetName -is "string" ) {
|
||||
Get-Variable -Name 'HeaderName','NoHeader','StartRow','Key','Property','ExcludeProperty','WorksheetName' -ErrorAction SilentlyContinue |
|
||||
Where-Object {$_.Value} | ForEach-Object -Begin {$params= @{} } -Process {$params[$_.Name] = $_.Value}
|
||||
|
||||
Write-Progress -Activity "Merging sheets" -CurrentOperation "Comparing $($filestoProcess[-1]) against $($filestoProcess[0]). "
|
||||
Write-Progress -Activity "Merging sheets" -CurrentOperation "comparing '$WorksheetName' in $($filestoProcess[-1]) against $($filestoProcess[0]). "
|
||||
$merged = Merge-Worksheet @params -Referencefile $filestoProcess[0] -Differencefile $filestoProcess[-1]
|
||||
$nextFileNo = 2
|
||||
while ($nextFileNo -lt $filestoProcess.count -and $merged) {
|
||||
Write-Progress -Activity "Merging sheets" -CurrentOperation "Comparing $($filestoProcess[-$nextFileNo]) against $($filestoProcess[0]). "
|
||||
Write-Progress -Activity "Merging sheets" -CurrentOperation "comparing '$WorksheetName' in $($filestoProcess[-$nextFileNo]) against $($filestoProcess[0]). "
|
||||
$merged = Merge-Worksheet @params -ReferenceObject $merged -Differencefile $filestoProcess[-$nextFileNo]
|
||||
$nextFileNo ++
|
||||
|
||||
}
|
||||
}
|
||||
#Merge different sheets from one workbook
|
||||
elseif ($filestoProcess.Count -eq 1 -and $WorkSheetName.Count -ge 2 ) {
|
||||
elseif ($filestoProcess.Count -eq 1 -and $WorksheetName.Count -ge 2 ) {
|
||||
Get-Variable -Name 'HeaderName','NoHeader','StartRow','Key','Property','ExcludeProperty' -ErrorAction SilentlyContinue |
|
||||
Where-Object {$_.Value} | ForEach-Object -Begin {$params= @{} } -Process {$params[$_.Name] = $_.Value}
|
||||
|
||||
Write-Progress -Activity "Merging sheets" -CurrentOperation "Comparing $($WorkSheetName[-1]) against $($WorkSheetName[0]). "
|
||||
$merged = Merge-Worksheet @params -Referencefile $filestoProcess[0] -Differencefile $filestoProcess[0] -WorkSheetName $WorkSheetName[0,-1]
|
||||
Write-Progress -Activity "Merging sheets" -CurrentOperation "Comparing $($WorksheetName[-1]) against $($WorksheetName[0]). "
|
||||
$merged = Merge-Worksheet @params -Referencefile $filestoProcess[0] -Differencefile $filestoProcess[0] -WorksheetName $WorksheetName[0,-1]
|
||||
$nextSheetNo = 2
|
||||
while ($nextSheetNo -lt $WorkSheetName.count -and $merged) {
|
||||
Write-Progress -Activity "Merging sheets" -CurrentOperation "Comparing $($WorkSheetName[-$nextSheetNo]) against $($WorkSheetName[0]). "
|
||||
$merged = Merge-Worksheet @params -ReferenceObject $merged -Differencefile $filestoProcess[0] -WorkSheetName $WorkSheetName[-$nextSheetNo] -DiffPrefix $WorkSheetName[-$nextSheetNo]
|
||||
while ($nextSheetNo -lt $WorksheetName.count -and $merged) {
|
||||
Write-Progress -Activity "Merging sheets" -CurrentOperation "Comparing $($WorksheetName[-$nextSheetNo]) against $($WorksheetName[0]). "
|
||||
$merged = Merge-Worksheet @params -ReferenceObject $merged -Differencefile $filestoProcess[0] -WorksheetName $WorksheetName[-$nextSheetNo] -DiffPrefix $WorksheetName[-$nextSheetNo]
|
||||
$nextSheetNo ++
|
||||
}
|
||||
}
|
||||
#We either need one worksheet name and many files or one file and many sheets.
|
||||
#We either need one Worksheet name and many files or one file and many sheets.
|
||||
else { Write-Warning -Message "Need at least two files to process" ; return }
|
||||
#if the process didn't return data then abandon now.
|
||||
if (-not $merged) {Write-Warning -Message "The merge operation did not return any data."; return }
|
||||
|
||||
$orderByProperties = $merged[0].psobject.properties.where({$_.name -match "row$"}).name
|
||||
Write-Progress -Activity "Merging sheets" -CurrentOperation "Creating output sheet '$OutputSheetName' in $OutputFile"
|
||||
$excel = $merged | Sort-Object -Property $orderByProperties | Update-FirstObjectProperties |
|
||||
Export-Excel -Path $OutputFile -WorkSheetname $OutputSheetName -ClearSheet -BoldTopRow -AutoFilter -PassThru
|
||||
Write-Progress -Activity "Merging sheets" -CurrentOperation "creating output sheet '$OutputSheetName' in $OutputFile"
|
||||
$excel = $merged | Sort-Object -Property $orderByProperties |
|
||||
Export-Excel -Path $OutputFile -Worksheetname $OutputSheetName -ClearSheet -BoldTopRow -AutoFilter -PassThru
|
||||
$sheet = $excel.Workbook.Worksheets[$OutputSheetName]
|
||||
|
||||
#We will put in a conditional format for "if all the others are not flagged as 'same'" to mark rows where something is added, removed or changed
|
||||
@@ -424,8 +479,8 @@ Function Merge-MultipleSheets {
|
||||
if ($filesToProcess.Count -ge 2) {
|
||||
$refPrefix = (Split-Path -Path $filestoProcess[0] -Leaf) -replace "\.xlsx$"," "
|
||||
}
|
||||
else {$refPrefix = $WorkSheetName[0] }
|
||||
Write-Progress -Activity "Merging sheets" -CurrentOperation "Applying formatting to sheet '$OutputSheetName' in $OutputFile"
|
||||
else {$refPrefix = $WorksheetName[0] }
|
||||
Write-Progress -Activity "Merging sheets" -CurrentOperation "applying formatting to sheet '$OutputSheetName' in $OutputFile"
|
||||
#Find the column headings which are in the form "diffFile is"; which will hold 'Same', 'Added' or 'Changed'
|
||||
foreach ($cell in $sheet.Cells[($sheet.Dimension.Address -replace "\d+$","1")].Where({$_.value -match "\sIS$"}) ) {
|
||||
#Work leftwards across the headings applying conditional formatting which says
|
||||
@@ -434,7 +489,7 @@ Function Merge-MultipleSheets {
|
||||
$columnNo = $cell.start.Column -1
|
||||
$cellAddr = [OfficeOpenXml.ExcelAddress]::TranslateFromR1C1("R1C$columnNo",1,$columnNo)
|
||||
while ($sheet.cells[$cellAddr].value -match $prefix) {
|
||||
$condFormattingParams = @{RuleType='Expression'; BackgroundPattern='Solid'; WorkSheet=$sheet; Range=$([OfficeOpenXml.ExcelAddress]::TranslateFromR1C1("R[1]C[$columnNo]:R[1048576]C[$columnNo]",0,0)) }
|
||||
$condFormattingParams = @{RuleType='Expression'; BackgroundPattern='Solid'; Worksheet=$sheet; StopIfTrue=$true; Range=$([OfficeOpenXml.ExcelAddress]::TranslateFromR1C1("R[1]C[$columnNo]:R[1048576]C[$columnNo]",0,0)) }
|
||||
Add-ConditionalFormatting @condFormattingParams -ConditionValue ($cell.Address + '="Added"' ) -BackgroundColor $AddBackgroundColor
|
||||
Add-ConditionalFormatting @condFormattingParams -ConditionValue ($cell.Address + '="Changed"') -BackgroundColor $ChangeBackgroundColor
|
||||
Add-ConditionalFormatting @condFormattingParams -ConditionValue ($cell.Address + '="Removed"') -BackgroundColor $DeleteBackgroundColor
|
||||
@@ -450,15 +505,16 @@ Function Merge-MultipleSheets {
|
||||
$nameRegex = $colNames -Join '|'
|
||||
foreach ($cell in $sheet.Cells[($sheet.Dimension.Address -replace "\d+$","1")].Where({$_.value -Notmatch $nameRegex}) ) {
|
||||
$cell.Value = $refPrefix + $cell.Value
|
||||
$condFormattingParams = @{RuleType='Expression'; BackgroundPattern='None'; WorkSheet=$sheet; Range=[OfficeOpenXml.ExcelAddress]::TranslateFromR1C1("R[2]C[$($cell.start.column)]:R[1048576]C[$($cell.start.column)]",0,0)}
|
||||
Add-ConditionalFormatting @condFormattingParams -ConditionValue ("OR(" +(($sameChecks -join ",") -replace '<>"Same"','="Added"') +")" ) -BackgroundColor $DeleteBackgroundColor
|
||||
$condFormattingParams = @{RuleType='Expression'; BackgroundPattern='Solid'; Worksheet=$sheet; StopIfTrue=$true; Range=[OfficeOpenXml.ExcelAddress]::TranslateFromR1C1("R[2]C[$($cell.start.column)]:R[1048576]C[$($cell.start.column)]",0,0)}
|
||||
Add-ConditionalFormatting @condFormattingParams -ConditionValue ("OR(" +(($sameChecks -join ",") -replace '<>"Same"','="Added"' ) +")" ) -BackgroundColor $DeleteBackgroundColor
|
||||
Add-ConditionalFormatting @condFormattingParams -ConditionValue ("AND(" +(($sameChecks -join ",") -replace '<>"Same"','="Changed"') +")" ) -BackgroundColor $ChangeBackgroundColor
|
||||
}
|
||||
#We've made a bunch of things wider so now is the time to autofit columns. Any hiding has to come AFTER this, because it unhides things
|
||||
$sheet.Cells.AutoFitColumns()
|
||||
|
||||
#if we have a key field (we didn't concatenate all fields) use what we built up in $sameChecks to apply conditional formatting to it (Row no will be in column A, Key in Column B)
|
||||
if ($Key -ne '*') {
|
||||
Add-ConditionalFormatting -WorkSheet $sheet -Range "B2:B1048576" -ForeGroundColor $KeyFontColor -BackgroundPattern 'None' -RuleType Expression -ConditionValue ("OR(" +($sameChecks -join ",") +")" )
|
||||
Add-ConditionalFormatting -Worksheet $sheet -Range "B2:B1048576" -ForeGroundColor $KeyFontColor -BackgroundPattern 'None' -RuleType Expression -ConditionValue ("OR(" +($sameChecks -join ",") +")" )
|
||||
$sheet.view.FreezePanes(2, 3)
|
||||
}
|
||||
else {$sheet.view.FreezePanes(2, 2) }
|
||||
@@ -473,8 +529,8 @@ Function Merge-MultipleSheets {
|
||||
$sheet.Column($cell.start.Column).HIDDEN = $true
|
||||
}
|
||||
}
|
||||
|
||||
Close-ExcelPackage -ExcelPackage $excel -Show:$Show
|
||||
if ($Passthru) {$excel}
|
||||
else {Close-ExcelPackage -ExcelPackage $excel -Show:$Show}
|
||||
Write-Progress -Activity "Merging sheets" -Completed
|
||||
}
|
||||
}
|
||||
|
||||
@@ -1,16 +1,16 @@
|
||||
function New-ConditionalFormattingIconSet {
|
||||
<#
|
||||
.SYNOPSIS
|
||||
Creates an object which describes a conditional formatting rule a for 3,4 or 5 icon set
|
||||
Creates an object which describes a conditional formatting rule a for 3,4 or 5 icon set.
|
||||
.DESCRIPTION
|
||||
Export-Excel takes a -ConditionalFormat parameter which can hold one or more descriptions for conditional formats;
|
||||
this command builds the
|
||||
this command builds the defintion of a Conditional formatting rule for an icon set.
|
||||
.PARAMETER Range
|
||||
The range of cells that the conditional format applies to
|
||||
The range of cells that the conditional format applies to.
|
||||
.PARAMETER ConditionalFormat
|
||||
The type of rule: one of "ThreeIconSet","FourIconSet" or "FiveIconSet"
|
||||
.PARAMETER IconType
|
||||
The name of an iconSet - different icons are available depending on whether 3,4 or 5 icon set is selected
|
||||
The name of an iconSet - different icons are available depending on whether 3,4 or 5 icon set is selected.
|
||||
.PARAMETER Reverse
|
||||
Use the icons in the reverse order.
|
||||
.Example
|
||||
@@ -18,9 +18,14 @@ function New-ConditionalFormattingIconSet {
|
||||
$cfdef = New-ConditionalFormattingIconSet -Range $cfrange -ConditionalFormat ThreeIconSet -IconType Arrows
|
||||
Export-Excel -ExcelPackage $excel -ConditionalFormat $cfdef -show
|
||||
|
||||
The first line creates a range - one column wide in the column $column, running from $topRow to $lastDataRow.
|
||||
The second creates a definition object using this range
|
||||
and the third uses Export-Excel with an open package to apply the format and save and open the file.
|
||||
The first line creates a range - one column wide in the column $column, running
|
||||
from $topRow to $lastDataRow.
|
||||
The second line creates a definition object using this range
|
||||
and the third uses Export-Excel with an open package to apply the format and
|
||||
save and open the file.
|
||||
.Link
|
||||
Add-Add-ConditionalFormatting
|
||||
New-ConditionalText
|
||||
#>
|
||||
param(
|
||||
[Parameter(Mandatory=$true)]
|
||||
|
||||
@@ -5,7 +5,7 @@ function New-ConditionalText {
|
||||
.DESCRIPTION
|
||||
Some Conditional formatting rules don't apply styles to a cell (IconSets and Databars).
|
||||
Some take two parameters (Between).
|
||||
Some take none (ThisWeek , containsErrors, AboveAverage etc).
|
||||
Some take none (ThisWeek, ContainsErrors, AboveAverage etc).
|
||||
The others take a single parameter (Top, BottomPercent, GreaterThan, Contains etc).
|
||||
This command creates an object to describe the last two categories, which can then be passed to Export-Excel.
|
||||
.PARAMETER Range
|
||||
@@ -13,35 +13,44 @@ function New-ConditionalText {
|
||||
.PARAMETER ConditionalType
|
||||
One of the supported rules; by default "ContainsText" is selected.
|
||||
.PARAMETER Text
|
||||
The text (or other value) to use in the rule. Not that Equals, GreaterThan/LessThan rules require text to wrapped in double quotes.
|
||||
The text (or other value) to use in the rule. Note that Equals, GreaterThan/LessThan rules require text to wrapped in double quotes.
|
||||
.PARAMETER ConditionalTextColor
|
||||
The font color for the cell - by default: Dark red.
|
||||
The font color for the cell - by default: "DarkRed".
|
||||
.PARAMETER BackgroundColor
|
||||
The fill color for the cell - by default: Light pink.
|
||||
The fill color for the cell - by default: "LightPink".
|
||||
.PARAMETER PatternType
|
||||
The Background pattern for the cell - by default: Solid
|
||||
The background pattern for the cell - by default: "Solid"
|
||||
.EXAMPLE
|
||||
>
|
||||
$ct = New-ConditionalText -Text 'Ferrari'
|
||||
Export-Excel -ExcelPackage $excel -ConditionalTest $ct -show
|
||||
|
||||
The first line creates a definition object which will highlight the word "Ferrari" in any cell.
|
||||
and the second uses Export-Excel with an open package to apply the format and save and open the file.
|
||||
The first line creates a definition object which will highlight the word
|
||||
"Ferrari" in any cell. and the second uses Export-Excel with an open package
|
||||
to apply the format and save and open the file.
|
||||
.EXAMPLE
|
||||
>
|
||||
$ct = New-ConditionalText -Text "Ferrari"
|
||||
$ct2 = New-ConditionalText -Range $worksheet.Names["FinishPosition"].Address -ConditionalType LessThanOrEqual -Text 3 -ConditionalTextColor Red -BackgroundColor White
|
||||
Export-Excel -ExcelPackage $excel -ConditionalText $ct,$ct2 -show
|
||||
|
||||
This builds on the previous example, and specifies a condition of <=3 with a format of Red text on a white background; this applies to a named range "Finish Position"
|
||||
the range could be written "C:C" to specify a named column, or "C2:C102" to specify certain cells in the column.
|
||||
This builds on the previous example, and specifies a condition of <=3 with
|
||||
a format of red text on a white background; this applies to a named range
|
||||
"Finish Position". The range could be written -Range "C:C" to specify a
|
||||
named column, or -Range "C2:C102" to specify certain cells in the column.
|
||||
.Link
|
||||
Add-Add-ConditionalFormatting
|
||||
New-ConditionalFormattingIconSet
|
||||
#>
|
||||
|
||||
[cmdletbinding()]
|
||||
param(
|
||||
#[Parameter(Mandatory=$true)]
|
||||
[Alias("ConditionValue")]
|
||||
$Text,
|
||||
[Alias("ForeGroundColor")]
|
||||
[System.Drawing.Color]$ConditionalTextColor="DarkRed",
|
||||
[System.Drawing.Color]$BackgroundColor="LightPink",
|
||||
$ConditionalTextColor=[System.Drawing.Color]::DarkRed,
|
||||
$BackgroundColor=[System.Drawing.Color]::LightPink,
|
||||
[String]$Range,
|
||||
[OfficeOpenXml.Style.ExcelFillStyle]$PatternType=[OfficeOpenXml.Style.ExcelFillStyle]::Solid,
|
||||
[ValidateSet(
|
||||
|
||||
@@ -4,8 +4,8 @@
|
||||
Creates a Definition of a chart which can be added using Export-Excel, or Add-PivotTable
|
||||
.DESCRIPTION
|
||||
All the parameters which are passed to Add-ExcelChart can be added to an object and
|
||||
passed to Export-Excel with the -ExcelChartDefinition parameter,
|
||||
or to Add-PivotTable with the -PivotChartDefinition parameter.
|
||||
passed to Export-Excel with the -ExcelChartDefinition parameter,
|
||||
or to Add-PivotTable with the -PivotChartDefinition parameter.
|
||||
This command sets up those definitions.
|
||||
.PARAMETER Title
|
||||
The title for the chart.
|
||||
@@ -20,23 +20,23 @@
|
||||
.PARAMETER YRange
|
||||
The range(s) of cells holding values for the Y-Axis - usually "data".
|
||||
.PARAMETER Width
|
||||
Width of the chart in Pixels. Defaults to 500.
|
||||
Width of the chart in pixels. Defaults to 500.
|
||||
.PARAMETER Height
|
||||
Height of the chart in Pixels. Defaults to 350.
|
||||
Height of the chart in pixels. Defaults to 350.
|
||||
.PARAMETER Row
|
||||
Row position of the top left corner of the chart. 0 places at the top of the sheet, 1 below row 1 and so on.
|
||||
.PARAMETER RowOffSetPixels
|
||||
Offset to position the chart by a fraction of of a row.
|
||||
Offset to position the chart by a fraction of a row.
|
||||
.PARAMETER Column
|
||||
Column position of the top left corner of the chart. 0 places at the edge of the sheet 1 to the right of column A and so on.
|
||||
.PARAMETER ColumnOffSetPixels
|
||||
Offset to position the chart by a fraction of of a column.
|
||||
Offset to position the chart by a fraction of a column.
|
||||
.PARAMETER NoLegend
|
||||
If specified, turns of display of the key. If you only have one data series it may be preferable to use the title to say what the chart is.
|
||||
If specified, turns off display of the key. If you only have one data series it may be preferable to use the title to say what the chart is.
|
||||
.PARAMETER SeriesHeader
|
||||
Specify explicit name(s) for the data series, which will appear in the legend/key
|
||||
Specifies explicit name(s) for the data series, which will appear in the legend/key
|
||||
.PARAMETER LegendPosition
|
||||
Location of the key, either left, right, top, bottom or TopRight.
|
||||
Location of the key, either "Left", "Right", "Top", "Bottom" or "TopRight".
|
||||
.PARAMETER LegendSize
|
||||
Font size for the key.
|
||||
.PARAMETER LegendBold
|
||||
@@ -62,7 +62,7 @@
|
||||
.PARAMETER XMinValue
|
||||
Minimum value for the scale along the X-axis.
|
||||
.PARAMETER xAxisPosition
|
||||
Postion for the X-axis (Top or Bottom).
|
||||
Position for the X-axis ("Top" or" Bottom").
|
||||
.PARAMETER YAxisTitleText
|
||||
Specifies a title for the Y-axis.
|
||||
.PARAMETER YAxisTitleBold
|
||||
@@ -80,7 +80,7 @@
|
||||
.PARAMETER YMinValue
|
||||
Minimum value on the Y-axis.
|
||||
.PARAMETER YAxisPosition
|
||||
Postion for the Y-axis (Left or Right).
|
||||
Position for the Y-axis ("Left" or "Right").
|
||||
.PARAMETER Header
|
||||
No longer used. This may be removed in future versions.
|
||||
.Example
|
||||
@@ -92,7 +92,8 @@
|
||||
|
||||
0..360 | ForEach-Object {[pscustomobject][ordered]@{x = $_; Sinx = "=Sin(Radians(x)) "}} | Export-Excel -AutoNameRange -now -WorkSheetname SinX -ExcelChartDefinition $cDef -Show
|
||||
|
||||
This reworks an example from Add-Excel-Chart but here the chart definition is defined and then it is used in a call to Export-Excel.
|
||||
This reworks an example from Add-Excel-Chart but here the chart is defined
|
||||
and the defintion stored in $cDef and then Export-Excel uses $cDef .
|
||||
#>
|
||||
[Alias("New-ExcelChart")] #This was the former name. The new name reflects that we are defining a chart, not making one in the workbook.
|
||||
[cmdletbinding()]
|
||||
@@ -218,7 +219,7 @@ function Add-ExcelChart {
|
||||
.PARAMETER NoLegend
|
||||
If specified, turns of display of the key. If you only have one data series it may be preferable to use the title to say what the chart is.
|
||||
.PARAMETER SeriesHeader
|
||||
Specify explicit name(s) for the data series, which will appear in the legend/key
|
||||
Specify explicit name(s) for the data series, which will appear in the legend/key. The contents of a cell can be specified in the from =Sheet9!Z10 .
|
||||
.PARAMETER LegendPosition
|
||||
Location of the key, either left, right, top, bottom or TopRight.
|
||||
.PARAMETER LegendSize
|
||||
@@ -312,15 +313,15 @@ function Add-ExcelChart {
|
||||
-SeriesHeader "Sin(x)" -LegendSize 8 -legendBold -LegendPosition Bottom
|
||||
Close-ExcelPackage $Excel -Show
|
||||
|
||||
The first line puts numbers from 0 to 360 into a sheet, as the first column, and
|
||||
The first line puts numbers from 0 to 360 into a sheet, as the first column, and
|
||||
a formula to calculate the Sine of that number of number of degrees in the second column.
|
||||
It creates named-ranges for the two columns - "X" and "SinX" respectively
|
||||
The Add-ExcelChart command adds a chart to that worksheet, specifying a line chart
|
||||
The Add-ExcelChart command adds a chart to that worksheet, specifying a line chart
|
||||
with the X values coming from named-range "X" and the Y values coming from named-range "SinX".
|
||||
The chart has a title, and is positioned to the right of column 2 and sized 800 pixels wide
|
||||
The X-axis is labelled "Degrees", in bold 12 point type and runs from 0 to 361 with labels every 30,
|
||||
The X-axis is labelled "Degrees", in bold 12 point type and runs from 0 to 361 with labels every 30,
|
||||
and minor tick marks every 10. Degrees are shown padded to 3 digits.
|
||||
The Y-axis is labelled "Sine" and to allow some room above and below its scale runs from -1.25 to 1.25,
|
||||
The Y-axis is labelled "Sine" and to allow some room above and below its scale runs from -1.25 to 1.25,
|
||||
and is marked off in units of 0.25 shown to two decimal places.
|
||||
The key will for the chart will be at the bottom in 8 point bold type and the line will be named "Sin(x)".
|
||||
#>
|
||||
@@ -348,7 +349,7 @@ function Add-ExcelChart {
|
||||
[Switch]$NoLegend,
|
||||
[Switch]$ShowCategory,
|
||||
[Switch]$ShowPercent,
|
||||
$SeriesHeader,
|
||||
[String[]]$SeriesHeader,
|
||||
[Switch]$TitleBold,
|
||||
[Int]$TitleSize ,
|
||||
[String]$XAxisTitleText,
|
||||
@@ -387,8 +388,16 @@ function Add-ExcelChart {
|
||||
}
|
||||
else {
|
||||
for ($idx = 0; $idx -lt $chartDefCount; $idx += 1) {
|
||||
$Series = $chart.Series.Add($YRange[$idx], $XRange)
|
||||
if ($SeriesHeader.Count -gt 0) { $Series.Header = $SeriesHeader[$idx] }
|
||||
if ($Yrange.count -eq $xrange.count) {
|
||||
$Series = $chart.Series.Add($YRange[$idx], $XRange[$idx])
|
||||
}
|
||||
else {
|
||||
$Series = $chart.Series.Add($YRange[$idx], $XRange)
|
||||
}
|
||||
if ($SeriesHeader.Count -gt 0) {
|
||||
if ($SeriesHeader[$idx] -match '^=') {$Series.HeaderAddress = $SeriesHeader[$idx] -replace '^=',''}
|
||||
else {$Series.Header = $SeriesHeader[$idx] }
|
||||
}
|
||||
else { $Series.Header = "Series $($idx)"}
|
||||
}
|
||||
}
|
||||
@@ -400,14 +409,16 @@ function Add-ExcelChart {
|
||||
}
|
||||
if ($NoLegend) { $chart.Legend.Remove() }
|
||||
else {
|
||||
if ($LegendPosition) {$Chart.Legend.Position = $LegendPosition}
|
||||
if ($LegendSize) {$chart.Legend.Font.Size = $LegendSize}
|
||||
if ($legendBold) {$chart.Legend.Font.Bold = $true}
|
||||
if ($PSBoundParameters.ContainsKey('LegendPosition')) {$chart.Legend.Position = $LegendPosition}
|
||||
if ($PSBoundParameters.ContainsKey('LegendBold')) {$chart.Legend.Font.Bold = [boolean]$LegendBold}
|
||||
if ($LegendSize) {$chart.Legend.Font.Size = $LegendSize}
|
||||
}
|
||||
|
||||
if ($XAxisTitleText) {
|
||||
$chart.XAxis.Title.Text = $XAxisTitleText
|
||||
if ($XAxisTitleBold) {$chart.XAxis.Title.Font.Bold = $true}
|
||||
if ($PSBoundParameters.ContainsKey('XAxisTitleBold')) {
|
||||
$chart.XAxis.Title.Font.Bold = [boolean]$XAxisTitleBold
|
||||
}
|
||||
if ($XAxisTitleSize) {$chart.XAxis.Title.Font.Size = $XAxisTitleSize}
|
||||
}
|
||||
if ($XAxisPosition) {Write-Warning "X-axis position is not being set propertly at the moment, parameter ignored" }
|
||||
@@ -420,7 +431,9 @@ function Add-ExcelChart {
|
||||
|
||||
if ($YAxisTitleText) {
|
||||
$chart.YAxis.Title.Text = $YAxisTitleText
|
||||
if ($YAxisTitleBold) {$chart.YAxis.Title.Font.Bold = $true}
|
||||
if ($PSBoundParameters.ContainsKey('YAxisTitleBold')) {
|
||||
$chart.YAxis.Title.Font.Bold = [boolean]$YAxisTitleBold
|
||||
}
|
||||
if ($YAxisTitleSize) {$chart.YAxis.Title.Font.Size = $YAxisTitleSize}
|
||||
}
|
||||
if ($YAxisPosition) {Write-Warning "Y-axis position is not being set propertly at the moment, parameter ignored" }
|
||||
|
||||
@@ -1,19 +1,22 @@
|
||||
Function Open-ExcelPackage {
|
||||
<#
|
||||
.Synopsis
|
||||
Returns an Excel Package Object for the specified XLSX file
|
||||
Returns an ExcelPackage object for the specified XLSX fil.e
|
||||
.Description
|
||||
Import-Excel and Export-Excel open an Excel file, carry out their tasks and close it again.
|
||||
Sometimes it is necessary to open a file and do other work on it. Open-Excel package allows the file to be opened for these tasks.
|
||||
It takes a KillExcel switch to make sure Excel is not holding the file open; a password parameter for existing protected files,
|
||||
and a create switch to set-up a new file if no file already exists.
|
||||
Sometimes it is necessary to open a file and do other work on it.
|
||||
Open-ExcelPackage allows the file to be opened for these tasks.
|
||||
It takes a -KillExcel switch to make sure Excel is not holding the file open;
|
||||
a -Password parameter for existing protected files,
|
||||
and a -Create switch to set-up a new file if no file already exists.
|
||||
.Example
|
||||
>
|
||||
PS> $excel = Open-ExcelPackage -Path "$env:TEMP\test99.xlsx" -Create
|
||||
$ws = Add-WorkSheet -ExcelPackage $excel
|
||||
|
||||
This will create a new file in the temp folder if it doesn't already exist. It then adds a worksheet -
|
||||
because no name is specified it will use the default name of "Sheet1"
|
||||
This will create a new file in the temp folder if it doesn't already exist.
|
||||
It then adds a worksheet - because no name is specified it will use the
|
||||
default name of "Sheet1"
|
||||
.Example
|
||||
>
|
||||
PS> $excel = Open-ExcelPackage -path "$xlPath" -Password $password
|
||||
@@ -21,20 +24,21 @@
|
||||
Set-ExcelRange -Range $sheet1.Cells["E1:S1048576"], $sheet1.Cells["V1:V1048576"] -NFormat ([cultureinfo]::CurrentCulture.DateTimeFormat.ShortDatePattern)
|
||||
Close-ExcelPackage $excel -Show
|
||||
|
||||
This will open the password protected file at $xlPath using the password stored in $Password.
|
||||
Sheet1 is selected and formatting applied to two blocks of the sheet; then the file is and saved and loaded into Excel.
|
||||
This will open the password protected file at $xlPath using the password stored
|
||||
in $Password. Sheet1 is selected and formatting applied to two blocks of the sheet;
|
||||
then the file is and saved and loaded into Excel.
|
||||
#>
|
||||
[CmdLetBinding()]
|
||||
[Diagnostics.CodeAnalysis.SuppressMessageAttribute("PSAvoidUsingPlainTextForPassword","")]
|
||||
[OutputType([OfficeOpenXml.ExcelPackage])]
|
||||
Param (
|
||||
#The Path to the file to open
|
||||
#The path to the file to open.
|
||||
[Parameter(Mandatory=$true)]$Path,
|
||||
#If specified, any running instances of Excel will be terminated before opening the file.
|
||||
[switch]$KillExcel,
|
||||
#The password for a protected worksheet, as a [normal] string (not a secure string.)
|
||||
#The password for a protected worksheet, as a [normal] string (not a secure string).
|
||||
[String]$Password,
|
||||
#By default open only opens an existing file; -Create instructs it to create a new file if required.
|
||||
#By default Open-ExcelPackage will only opens an existing file; -Create instructs it to create a new file if required.
|
||||
[switch]$Create
|
||||
)
|
||||
|
||||
@@ -75,7 +79,7 @@ Function Close-ExcelPackage {
|
||||
.Description
|
||||
When working with an ExcelPackage object, the Workbook is held in memory and not saved until the .Save() method of the package is called.
|
||||
Close-ExcelPackage saves and disposes of the Package object. It can be called with -NoSave to abandon the file without saving, with a new "SaveAs" filename,
|
||||
and/or with a password to protect the file. And -Show will open the file in Excel;
|
||||
and/or with a password to protect the file. And -Show will open the file in Excel;
|
||||
-Calculate will try to update the workbook, although not everything can be recalculated
|
||||
.Example
|
||||
Close-ExcelPackage -show $excel
|
||||
|
||||
194
PivotTable.ps1
194
PivotTable.ps1
@@ -29,7 +29,7 @@
|
||||
|
||||
Add-PivotTable -PivotTableName Sales -Address $excel.Workbook.Worksheets[1].Cells["F1"] `
|
||||
-SourceWorkSheet $excel.Workbook.Worksheets[1] -PivotRows City -PivotColumns Product -PivotData @{Gross="Sum";Net="Sum"} `
|
||||
-PivotNumberFormat "$#,##0.00" -PivotTotals Both -PivotTableSyle Medium12 -PivotChartDefinition $chartdef
|
||||
-PivotNumberFormat "$#,##0.00" -PivotTotals Both -PivotTableStyle Medium12 -PivotChartDefinition $chartdef
|
||||
Close-ExcelPackage -show $excel
|
||||
|
||||
|
||||
@@ -38,9 +38,53 @@
|
||||
but here -Address is specified to place it beside the data. The Add-Pivot table is given the chart definition and told to create a tale
|
||||
using the City field to create rows, the Product field to create columns and the data should be the sum of the gross field and the sum of the net field;
|
||||
grand totals for both gross and net are included for rows (Cities) and columns (product) and the data is explicitly formatted as a currency.
|
||||
Not that in the chart definition the number format for the axis does not include any fraction part.
|
||||
Note that in the chart definition the number format for the axis does not include any fraction part.
|
||||
.Example
|
||||
>
|
||||
$excel = Convertfrom-csv @"
|
||||
Location,OrderDate,quantity
|
||||
Boston,1/1/2017,100
|
||||
New York,1/21/2017,200
|
||||
Boston,1/11/2017,300
|
||||
New York,1/9/2017,400
|
||||
Boston,1/18/2017,500
|
||||
Boston,2/1/2017,600
|
||||
New York,2/21/2017,700
|
||||
New York,2/11/2017,800
|
||||
Boston,2/9/2017,900
|
||||
Boston,2/18/2017,1000
|
||||
New York,1/1/2018,100
|
||||
Boston,1/21/2018,200
|
||||
New York,1/11/2018,300
|
||||
Boston,1/9/2018,400
|
||||
New York,1/18/2018,500
|
||||
Boston,2/1/2018,600
|
||||
Boston,2/21/2018,700
|
||||
New York,2/11/2018,800
|
||||
New York,2/9/2018,900
|
||||
Boston,2/18/2018,1000
|
||||
"@ | Select-Object -Property @{n="OrderDate";e={[datetime]::ParseExact($_.OrderDate,"M/d/yyyy",(Get-Culture))}},
|
||||
Location, Quantity | Export-Excel "test2.xlsx" -PassThru -AutoSize
|
||||
|
||||
Set-ExcelColumn -Worksheet $excel.sheet1 -Column 1 -NumberFormat 'Short Date'
|
||||
|
||||
$pt = Add-PivotTable -PassThru -PivotTableName "ByDate" -Address $excel.Sheet1.cells["F1"] -SourceWorkSheet $excel.Sheet1 -PivotRows location,orderdate -PivotData @{'quantity'='sum'} -GroupDateRow orderdate -GroupDatePart 'Months,Years' -PivotTotals None
|
||||
$pt.RowFields[0].SubtotalTop=$false
|
||||
$pt.RowFields[0].Compact=$false
|
||||
Close-ExcelPackage $excel -Show
|
||||
|
||||
Here the data contains dates formatted as strings using US format. These
|
||||
are converted to DateTime objects before being exported to Excel; the
|
||||
"OrderDate" column is formatted with the local short-date style. Then
|
||||
the PivotTable is added; it groups information by date and location, the
|
||||
date is split into years and then months. No grand totals are displayed.
|
||||
The Pivot table object is caught in a variable, and the "Location"
|
||||
column has its subtotal moved from the top to the bottom of each location
|
||||
section, and the "Compact" option is disabled to prevent "Year" moving
|
||||
into the same column as location.
|
||||
Finally the workbook is saved and shown in Excel.
|
||||
#>
|
||||
[cmdletbinding(defaultParameterSetName='ChartbyParams')]
|
||||
[cmdletbinding(defaultParameterSetName = 'ChartbyParams')]
|
||||
[OutputType([OfficeOpenXml.Table.PivotTable.ExcelPivotTable])]
|
||||
param (
|
||||
#Name for the new PivotTable - this will be the name of a sheet in the Workbook.
|
||||
@@ -67,52 +111,64 @@
|
||||
#If there are multiple data items in a PivotTable, by default they are shown on separate rows; this switch makes them separate columns.
|
||||
[Switch]$PivotDataToColumn,
|
||||
#Define whether totals should be added to rows, columns neither, or both (the default is both).
|
||||
[ValidateSet("Both","Columns","Rows","None")]
|
||||
[ValidateSet("Both", "Columns", "Rows", "None")]
|
||||
[String]$PivotTotals = "Both",
|
||||
#Included for compatibility - equivalent to -PivotTotals "None".
|
||||
[Switch]$NoTotalsInPivot,
|
||||
#The name of a row field which should be grouped by parts of the date/time (ignored if GroupDateRow is not specified)
|
||||
[String]$GroupDateRow,
|
||||
#The Part(s) of the date to use in the grouping (ignored if GroupDateRow is not specified)
|
||||
[OfficeOpenXml.Table.PivotTable.eDateGroupBy[]]$GroupDatePart,
|
||||
#The name of a row field which should be grouped by Number (e.g 0-99, 100-199, 200-299 )
|
||||
[String]$GroupNumericRow,
|
||||
#The starting point for grouping
|
||||
[double]$GroupNumericMin = 0 ,
|
||||
#The endpoint for grouping
|
||||
[double]$GroupNumericMax = [Double]::MaxValue ,
|
||||
#The interval for grouping
|
||||
[double]$GroupNumericInterval = 100 ,
|
||||
#Number format to apply to the data cells in the PivotTable.
|
||||
[string]$PivotNumberFormat,
|
||||
#Apply a table style to the PivotTable.
|
||||
[OfficeOpenXml.Table.TableStyles]$PivotTableSyle,
|
||||
[OfficeOpenXml.Table.TableStyles]$PivotTableStyle,
|
||||
#Use a chart definition instead of specifying chart settings one by one.
|
||||
[Parameter(ParameterSetName='ChartbyDef', Mandatory=$true, ValueFromPipelineByPropertyName=$true)]
|
||||
[Parameter(ParameterSetName = 'ChartbyDef', Mandatory = $true, ValueFromPipelineByPropertyName = $true)]
|
||||
$PivotChartDefinition,
|
||||
#If specified, a chart will be included.
|
||||
[Parameter(ParameterSetName='ChartbyParams')]
|
||||
[Parameter(ParameterSetName = 'ChartbyParams')]
|
||||
[Switch]$IncludePivotChart,
|
||||
#Optional title for the pivot chart, by default the title omitted.
|
||||
[Parameter(ParameterSetName='ChartbyParams')]
|
||||
[Parameter(ParameterSetName = 'ChartbyParams')]
|
||||
[String]$ChartTitle = "",
|
||||
#Height of the chart in Pixels (400 by default).
|
||||
[Parameter(ParameterSetName='ChartbyParams')]
|
||||
[Parameter(ParameterSetName = 'ChartbyParams')]
|
||||
[int]$ChartHeight = 400 ,
|
||||
#Width of the chart in Pixels (600 by default).
|
||||
[Parameter(ParameterSetName='ChartbyParams')]
|
||||
[Parameter(ParameterSetName = 'ChartbyParams')]
|
||||
[int]$ChartWidth = 600,
|
||||
#Cell position of the top left corner of the chart, there will be this number of rows above the top edge of the chart (default is 0, chart starts at top edge of row 1).
|
||||
[Parameter(ParameterSetName='ChartbyParams')]
|
||||
[Parameter(ParameterSetName = 'ChartbyParams')]
|
||||
[Int]$ChartRow = 0 ,
|
||||
#Cell position of the top left corner of the chart, there will be this number of cells to the left of the chart (default is 4, chart starts at left edge of column E).
|
||||
[Parameter(ParameterSetName='ChartbyParams')]
|
||||
[Parameter(ParameterSetName = 'ChartbyParams')]
|
||||
[Int]$ChartColumn = 4,
|
||||
#Vertical offset of the chart from the cell corner.
|
||||
[Parameter(ParameterSetName='ChartbyParams')]
|
||||
[Parameter(ParameterSetName = 'ChartbyParams')]
|
||||
[Int]$ChartRowOffSetPixels = 0 ,
|
||||
[Parameter(ParameterSetName='ChartbyParams')]
|
||||
[Parameter(ParameterSetName = 'ChartbyParams')]
|
||||
#Horizontal offset of the chart from the cell corner.
|
||||
[Int]$ChartColumnOffSetPixels = 0,
|
||||
#Type of chart; defaults to "Pie".
|
||||
[Parameter(ParameterSetName='ChartbyParams')]
|
||||
[Parameter(ParameterSetName = 'ChartbyParams')]
|
||||
[OfficeOpenXml.Drawing.Chart.eChartType]$ChartType = 'Pie',
|
||||
#If specified hides the chart legend.
|
||||
[Parameter(ParameterSetName='ChartbyParams')]
|
||||
[Parameter(ParameterSetName = 'ChartbyParams')]
|
||||
[Switch]$NoLegend,
|
||||
#If specified attaches the category to slices in a pie chart : not supported on all chart types, this may give errors if applied to an unsupported type.
|
||||
[Parameter(ParameterSetName='ChartbyParams')]
|
||||
[Parameter(ParameterSetName = 'ChartbyParams')]
|
||||
[Switch]$ShowCategory,
|
||||
#If specified attaches percentages to slices in a pie chart.
|
||||
[Parameter(ParameterSetName='ChartbyParams')]
|
||||
[Parameter(ParameterSetName = 'ChartbyParams')]
|
||||
[Switch]$ShowPercent,
|
||||
#If there is already content in the workbook the sheet with the PivotTable will not be active UNLESS Activate is specified.
|
||||
[switch]$Activate,
|
||||
@@ -121,7 +177,7 @@
|
||||
)
|
||||
if ($PivotTableName.length -gt 250) {
|
||||
Write-warning -Message "PivotTable name will be truncated"
|
||||
$PivotTableName = $PivotTableName.Substring(0,250)
|
||||
$PivotTableName = $PivotTableName.Substring(0, 250)
|
||||
}
|
||||
if ($Address) {
|
||||
[OfficeOpenXml.ExcelWorksheet]$wsPivot = $address.Worksheet
|
||||
@@ -131,7 +187,7 @@
|
||||
if (-not $ExcelPackage) {Write-Warning -message "This combination of Parameters needs to include the ExcelPackage." ; return }
|
||||
[OfficeOpenXml.ExcelWorksheet]$wsPivot = Add-WorkSheet -ExcelPackage $ExcelPackage -WorksheetName $pivotTableName -Activate:$Activate
|
||||
if ($wsPivot.Name -ne $PivotTableName) {Write-Warning -Message "The Worksheet name for the PivotTable does not match the table name '$PivotTableName'; probably because excess or illegal characters were removed." }
|
||||
if ($PivotFilter) {$Address = $wsPivot.Cells["A3"]} else { $Address = $wsPivot.Cells["A1"]}
|
||||
if ($PivotFilter) {$Address = $wsPivot.Cells["A3"]} else { $Address = $wsPivot.Cells["A1"]}
|
||||
}
|
||||
catch {throw "Could not create the sheet for the PivotTable. $_" }
|
||||
}
|
||||
@@ -140,25 +196,25 @@
|
||||
if (-not $wsPivot.PivotTables[$pivotTableName] ) {
|
||||
try {
|
||||
#Accept a string or a worksheet object as $SourceWorksheet - we don't need a worksheet if we have a Rangebase .
|
||||
if ( $SourceWorkSheet -is [string]) {
|
||||
$SourceWorkSheet = $ExcelPackage.Workbook.Worksheets.where( {$_.name -Like $SourceWorkSheet})[0]
|
||||
if ( $SourceWorkSheet -is [string]) {
|
||||
$SourceWorkSheet = $ExcelPackage.Workbook.Worksheets.where( {$_.name -Like $SourceWorkSheet})[0]
|
||||
}
|
||||
elseif ( $SourceWorkSheet -is [int] ) {
|
||||
$SourceWorkSheet = $ExcelPackage.Workbook.Worksheets[$SourceWorkSheet]
|
||||
elseif ( $SourceWorkSheet -is [int] ) {
|
||||
$SourceWorkSheet = $ExcelPackage.Workbook.Worksheets[$SourceWorkSheet]
|
||||
}
|
||||
if ( $SourceRange -is [OfficeOpenXml.Table.ExcelTable]) {$SourceRange = $SourceRange.Address }
|
||||
if ( $sourceRange -is [OfficeOpenXml.ExcelRange] -or
|
||||
$SourceRange -is [OfficeOpenXml.ExcelAddress]) {
|
||||
if ( $SourceRange -is [OfficeOpenXml.Table.ExcelTable]) {$SourceRange = $SourceRange.Address }
|
||||
if ( $sourceRange -is [OfficeOpenXml.ExcelRange] -or
|
||||
$SourceRange -is [OfficeOpenXml.ExcelAddress]) {
|
||||
$pivotTable = $wsPivot.PivotTables.Add($Address, $SourceRange, $pivotTableName)
|
||||
}
|
||||
elseif (-not $SourceRange) {
|
||||
$pivotTable = $wsPivot.PivotTables.Add($Address, $SourceWorkSheet.cells[$SourceWorkSheet.Dimension.Address], $pivotTableName)
|
||||
}
|
||||
elseif ($SourceWorkSheet -isnot [OfficeOpenXml.ExcelWorksheet] ) {
|
||||
elseif ($SourceWorkSheet -isnot [OfficeOpenXml.ExcelWorksheet] ) {
|
||||
Write-Warning -Message "Could not find source Worksheet for pivot-table '$pivotTableName'." ; return
|
||||
}
|
||||
elseif ( $SourceRange -is [String] -or $SourceRange -is [OfficeOpenXml.ExcelAddress]) {
|
||||
$pivotTable = $wsPivot.PivotTables.Add($Address,$SourceWorkSheet.Cells[$SourceRange], $pivotTableName)
|
||||
elseif ( $SourceRange -is [String] -or $SourceRange -is [OfficeOpenXml.ExcelAddress]) {
|
||||
$pivotTable = $wsPivot.PivotTables.Add($Address, $SourceWorkSheet.Cells[$SourceRange], $pivotTableName)
|
||||
}
|
||||
else {Write-warning "Could not create a PivotTable with the Source Range provided."; return}
|
||||
foreach ($Row in $PivotRows) {
|
||||
@@ -192,13 +248,23 @@
|
||||
try { $null = $pivotTable.PageFields.Add($pivotTable.Fields[$pFilter])}
|
||||
catch {Write-Warning -message "Could not add '$pFilter' to Filter/Page fields in PivotTable $pivotTableName." }
|
||||
}
|
||||
if ($NoTotalsInPivot) {$PivotTotals = "None" }
|
||||
if ($PivotTotals -eq "None" -or $PivotTotals -eq "Columns") { $pivotTable.RowGrandTotals = $false }
|
||||
elseif ($PivotTotals -eq "Both" -or $PivotTotals -eq "Rows") { $pivotTable.RowGrandTotals = $true }
|
||||
if ($PivotTotals -eq "None" -or $PivotTotals -eq "Rows") { $pivotTable.ColumGrandTotals = $false } # Epplus spelling mistake, not mine!
|
||||
elseif ($PivotTotals -eq "Both" -or $PivotTotals -eq "Columns") { $pivotTable.ColumGrandTotals = $true }
|
||||
if ($PivotDataToColumn ) { $pivotTable.DataOnRows = $false }
|
||||
if ($PivotTableSyle) { $pivotTable.TableStyle = $PivotTableSyle}
|
||||
if ($PivotDataToColumn ) { $pivotTable.DataOnRows = $false }
|
||||
if ($PivotTableStyle) { $pivotTable.TableStyle = $PivotTableStyle}
|
||||
if ($GroupNumericRow) {
|
||||
$r = $pivotTable.RowFields.Where( {$_.name -eq $GroupNumericRow })
|
||||
if (-not $r ) {Write-Warning -Message "Could not find a Row field named '$GroupNumericRow'; no numeric grouping will be done."}
|
||||
else {$r.AddNumericGrouping($GroupNumericMin, $GroupNumericMax, $GroupNumericInterval)}
|
||||
}
|
||||
if ($GroupDateRow -and $PSBoundParameters.ContainsKey("GroupDatePart")) {
|
||||
$r = $pivotTable.RowFields.Where( {$_.name -eq $GroupDateRow })
|
||||
if (-not $r ) {Write-Warning -Message "Could not find a Row field named '$GroupDateRow'; no date grouping will be done."}
|
||||
else {$r.AddDateGrouping($GroupDatePart)}
|
||||
}
|
||||
}
|
||||
catch {Write-Warning -Message "Failed adding PivotTable '$pivotTableName': $_"}
|
||||
}
|
||||
@@ -211,16 +277,16 @@
|
||||
|
||||
#Create the chart if it doesn't exist, leave alone if it does.
|
||||
if ($IncludePivotChart -and -not $wsPivot.Drawings["Chart$pivotTableName"] ) {
|
||||
try {Add-ExcelChart -PivotTable $pivotTable -ChartType $ChartType -Width $ChartWidth -Height $ChartHeight -Row $ChartRow -Column $ChartColumn -RowOffSetPixels $ChartRowOffSetPixels -ColumnOffSetPixels $ChartColumnOffSetPixels -Title $ChartTitle -NoLegend:$NoLegend -ShowCategory:$ShowCategory -ShowPercent:$ShowPercent }
|
||||
catch {Write-Warning -Message "Failed adding chart for pivotable '$pivotTableName': $_"}
|
||||
}
|
||||
elseif ($PivotChartDefinition -and -not $wsPivot.Drawings["Chart$pivotTableName"]) {
|
||||
if ($PivotChartDefinition -is [System.Management.Automation.PSCustomObject]) {
|
||||
$params = @{PivotTable= $pivotTable }
|
||||
$params = @{PivotTable = $pivotTable }
|
||||
$PivotChartDefinition.PSObject.Properties | ForEach-Object {if ( $null -ne $_.value) {$params[$_.name] = $_.value}}
|
||||
Add-ExcelChart @params
|
||||
}
|
||||
elseif ($PivotChartDefinition -is [hashtable] -or $PivotChartDefinition -is[System.Collections.Specialized.OrderedDictionary]) {
|
||||
elseif ($PivotChartDefinition -is [hashtable] -or $PivotChartDefinition -is [System.Collections.Specialized.OrderedDictionary]) {
|
||||
Add-ExcelChart -PivotTable $pivotTable @PivotChartDefinition
|
||||
}
|
||||
}
|
||||
@@ -230,7 +296,7 @@
|
||||
function New-PivotTableDefinition {
|
||||
<#
|
||||
.Synopsis
|
||||
Creates PivotTable definitons for Export-Excel
|
||||
Creates PivotTable definitons for Export-Excel
|
||||
.Description
|
||||
Export-Excel allows a single PivotTable to be defined using the parameters -IncludePivotTable, -PivotColumns -PivotRows,
|
||||
-PivotData, -PivotFilter, -PivotTotals, -PivotDataToColumn, -IncludePivotChart and -ChartType.
|
||||
@@ -267,59 +333,71 @@ function New-PivotTableDefinition {
|
||||
[Switch]$PivotDataToColumn,
|
||||
#By default PivotTables have Totals for each Row (on the right) and for each column at the bottom. This allows just one or neither to be selected.
|
||||
#Define whther totals should be added to rows, columns neither, or both (the default is both)
|
||||
[ValidateSet("Both","Columns","Rows","None")]
|
||||
[ValidateSet("Both", "Columns", "Rows", "None")]
|
||||
[String]$PivotTotals = "Both",
|
||||
#Included for compatibility - equivalent to -PivotTotals "None"
|
||||
[Switch]$NoTotalsInPivot,
|
||||
#The name of a row field which should be grouped by parts of the date/time (ignored if GroupDateRow is not specified)
|
||||
[String]$GroupDateRow,
|
||||
#The Part(s) of the date to use in the grouping (ignored if GroupDateRow is not specified)
|
||||
[OfficeOpenXml.Table.PivotTable.eDateGroupBy[]]$GroupDatePart,
|
||||
#The name of a row field which should be grouped by Number (e.g 0-99, 100-199, 200-299 )
|
||||
[String]$GroupNumericRow,
|
||||
#The starting point for grouping
|
||||
[double]$GroupNumericMin = 0 ,
|
||||
#The endpoint for grouping
|
||||
[double]$GroupNumericMax = [Double]::MaxValue ,
|
||||
#The interval for grouping
|
||||
[double]$GroupNumericInterval = 100 ,
|
||||
#Number format to apply to the data cells in the PivotTable
|
||||
[string]$PivotNumberFormat,
|
||||
#Apply a table style to the PivotTable
|
||||
[OfficeOpenXml.Table.TableStyles]$PivotTableSyle,
|
||||
[OfficeOpenXml.Table.TableStyles]$PivotTableStyle,
|
||||
#Use a chart definition instead of specifying chart settings one by one
|
||||
[Parameter(ParameterSetName='ChartbyDef', Mandatory=$true, ValueFromPipelineByPropertyName=$true)]
|
||||
[Parameter(ParameterSetName = 'ChartbyDef', Mandatory = $true, ValueFromPipelineByPropertyName = $true)]
|
||||
$PivotChartDefinition,
|
||||
#If specified a chart Will be included.
|
||||
[Parameter(ParameterSetName='ChartbyParams')]
|
||||
[Parameter(ParameterSetName = 'ChartbyParams')]
|
||||
[Switch]$IncludePivotChart,
|
||||
#Optional title for the pivot chart, by default the title omitted.
|
||||
[Parameter(ParameterSetName='ChartbyParams')]
|
||||
[Parameter(ParameterSetName = 'ChartbyParams')]
|
||||
[String]$ChartTitle,
|
||||
#Height of the chart in Pixels (400 by default)
|
||||
[Parameter(ParameterSetName='ChartbyParams')]
|
||||
[Parameter(ParameterSetName = 'ChartbyParams')]
|
||||
[int]$ChartHeight = 400 ,
|
||||
#Width of the chart in Pixels (600 by default)
|
||||
[Parameter(ParameterSetName='ChartbyParams')]
|
||||
[Parameter(ParameterSetName = 'ChartbyParams')]
|
||||
[int]$ChartWidth = 600,
|
||||
#Cell position of the top left corner of the chart, there will be this number of rows above the top edge of the chart (default is 0, chart starts at top edge of row 1).
|
||||
[Parameter(ParameterSetName='ChartbyParams')]
|
||||
[Parameter(ParameterSetName = 'ChartbyParams')]
|
||||
[Int]$ChartRow = 0 ,
|
||||
#Cell position of the top left corner of the chart, there will be this number of cells to the left of the chart (default is 4, chart starts at left edge of column E)
|
||||
[Parameter(ParameterSetName='ChartbyParams')]
|
||||
[Parameter(ParameterSetName = 'ChartbyParams')]
|
||||
[Int]$ChartColumn = 4,
|
||||
#Vertical offset of the chart from the cell corner.
|
||||
[Parameter(ParameterSetName='ChartbyParams')]
|
||||
[Parameter(ParameterSetName = 'ChartbyParams')]
|
||||
[Int]$ChartRowOffSetPixels = 0 ,
|
||||
#Horizontal offset of the chart from the cell corner.
|
||||
[Parameter(ParameterSetName='ChartbyParams')]
|
||||
[Parameter(ParameterSetName = 'ChartbyParams')]
|
||||
[Int]$ChartColumnOffSetPixels = 0,
|
||||
#Type of chart
|
||||
[Parameter(ParameterSetName='ChartbyParams')]
|
||||
[Parameter(ParameterSetName = 'ChartbyParams')]
|
||||
[OfficeOpenXml.Drawing.Chart.eChartType]$ChartType = 'Pie',
|
||||
#If specified hides the chart legend
|
||||
[Parameter(ParameterSetName='ChartbyParams')]
|
||||
[Parameter(ParameterSetName = 'ChartbyParams')]
|
||||
[Switch]$NoLegend,
|
||||
#if specified attaches the category to slices in a pie chart : not supported on all chart types, this may give errors if applied to an unsupported type.
|
||||
[Parameter(ParameterSetName='ChartbyParams')]
|
||||
[Parameter(ParameterSetName = 'ChartbyParams')]
|
||||
[Switch]$ShowCategory,
|
||||
#If specified attaches percentages to slices in a pie chart.
|
||||
[Parameter(ParameterSetName='ChartbyParams')]
|
||||
[Parameter(ParameterSetName = 'ChartbyParams')]
|
||||
[Switch]$ShowPercent,
|
||||
#If there is already content in the workbook the sheet with the PivotTable will not be active UNLESS Activate is specified
|
||||
[switch]$Activate
|
||||
)
|
||||
$validDataFuntions = [system.enum]::GetNames([OfficeOpenXml.Table.PivotTable.DataFieldFunctions])
|
||||
|
||||
if ($PivotData.values.Where({$_ -notin $validDataFuntions}) ) {
|
||||
if ($PivotData.values.Where( {$_ -notin $validDataFuntions}) ) {
|
||||
Write-Warning -Message ("Pivot data functions might not be valid, they should be one of " + ($validDataFuntions -join ", ") + ".")
|
||||
}
|
||||
|
||||
@@ -330,8 +408,8 @@ function New-PivotTableDefinition {
|
||||
}
|
||||
$parameters.Remove('PivotTableName')
|
||||
if ($PivotChartDefinition) {
|
||||
$parameters.PivotChartDefinition.XRange = $null
|
||||
$parameters.PivotChartDefinition.YRange = $null
|
||||
$parameters.PivotChartDefinition.XRange = $null
|
||||
$parameters.PivotChartDefinition.YRange = $null
|
||||
$parameters.PivotChartDefinition.SeriesHeader = $null
|
||||
}
|
||||
@{$PivotTableName = $parameters}
|
||||
|
||||
30
README.md
30
README.md
@@ -53,7 +53,35 @@ Install-Module ImportExcel -scope CurrentUser
|
||||
Install-Module ImportExcel
|
||||
```
|
||||
|
||||
# What's new 5.3.3
|
||||
# What's new 5.4.3
|
||||
|
||||
- Added Remove-Worksheet: Removes one or more worksheets from one or more workbooks
|
||||
|
||||
|
||||
# What's new 5.4.2
|
||||
|
||||
- Added parameters -GroupDateRow and -GroupDatePart & -GroupNumericRow, -GroupNumericMin, -GroupNumericMax and -GroupNumericInterval
|
||||
to Add-PivotTable and New-PivotTableDefinition. The date ones gather dates of the same year and/or quarter and/or month and/or day etc.
|
||||
the number ones group numbers into bands, starting at Min, and going up steps specified by Interval. Added tests and help for these.
|
||||
- Set-ExcelRow and Set-ExcelColumn now check that the worksheet name they passed exists in the workbook.
|
||||
|
||||
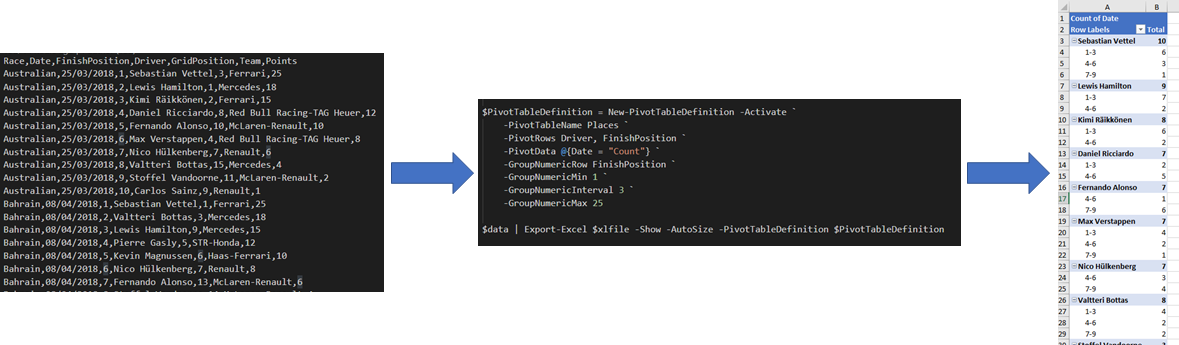
|
||||
|
||||
# What's new 5.4.0
|
||||
|
||||
- Thank you to Conrad Agramont, Twitter: [@AGramont](https://twitter.com/@AGramont) for the `AddMultiWorkSheet.ps1` example. Much appreciated!
|
||||
- Fixed several more bugs where parameters were ignored if passed a zero value
|
||||
- Fixed bug where chart series headers could not come form a cell reference (=Sheet1!Z10 now works as a header reference)
|
||||
- Add-Chart will now allow a single X range, or as many X ranges as there are Y ranges.
|
||||
- Merge-MultipleSheets is more robust.
|
||||
- Set-ExcelRow and Set-ExcelColumn trap attempts to process a sheet with no rows/columns.
|
||||
- Help has been proof-read (thanks to Mrs. @Jhoneill !).
|
||||
|
||||
# What's new 5.3.4
|
||||
|
||||
- HotFix for parameter PivotTableSyle should be PivotTableStyle https://github.com/dfinke/ImportExcel/issues/453
|
||||
|
||||
# What's new 5.3.3
|
||||
|
||||
- Thank you to (lazywinadmin)[https://github.com/lazywinadmin] - Expand aliases in examples and elsewhere
|
||||
- In Export-Excel fixed a bug where -AutoNameRange on pre-existing data included the header in the range.
|
||||
|
||||
@@ -1,34 +1,43 @@
|
||||
Function Remove-WorkSheet {
|
||||
Param (
|
||||
$Path,
|
||||
$WorksheetName
|
||||
<#
|
||||
.SYNOPSIS
|
||||
Removes one or more worksheets from one or more workbooks
|
||||
.EXAMPLE
|
||||
C:\> Remove-WorkSheet -Path Test1.xlsx -WorksheetName Sheet1
|
||||
Removes the worksheet named 'Sheet1' from 'Test1.xlsx'
|
||||
|
||||
C:\> Remove-WorkSheet -Path Test1.xlsx -WorksheetName Sheet1,Target1
|
||||
Removes the worksheet named 'Sheet1' and 'Target1' from 'Test1.xlsx'
|
||||
|
||||
C:\> Remove-WorkSheet -Path Test1.xlsx -WorksheetName Sheet1,Target1 -Show
|
||||
Removes the worksheets and then launches the xlsx in Excel
|
||||
|
||||
C:\> dir c:\reports\*.xlsx | Remove-WorkSheet
|
||||
Removes 'Sheet1' from all the xlsx files in the c:\reports directory
|
||||
|
||||
#>
|
||||
param(
|
||||
# [Parameter(ValueFromPipelineByPropertyName)]
|
||||
[Parameter(ValueFromPipelineByPropertyName)]
|
||||
[Alias('Path')]
|
||||
$FullName,
|
||||
[String[]]$WorksheetName = "Sheet1",
|
||||
[Switch]$Show
|
||||
)
|
||||
|
||||
$Path = (Resolve-Path $Path).ProviderPath
|
||||
|
||||
$Excel = New-Object -TypeName OfficeOpenXml.ExcelPackage $Path
|
||||
|
||||
$workSheet = $Excel.Workbook.Worksheets[$WorkSheetName]
|
||||
|
||||
if($workSheet) {
|
||||
if($Excel.Workbook.Worksheets.Count -gt 1) {
|
||||
$Excel.Workbook.Worksheets.Delete($workSheet)
|
||||
} else {
|
||||
throw "Cannot delete $WorksheetName. A workbook must contain at least one visible worksheet"
|
||||
Process {
|
||||
if (!$FullName) {
|
||||
throw "Remove-WorkSheet requires the and Excel file"
|
||||
}
|
||||
|
||||
} else {
|
||||
throw "$WorksheetName not found"
|
||||
$pkg = Open-ExcelPackage -Path $FullName
|
||||
|
||||
if ($pkg) {
|
||||
foreach ($wsn in $WorksheetName) {
|
||||
$pkg.Workbook.Worksheets.Delete($wsn)
|
||||
}
|
||||
|
||||
Close-ExcelPackage -ExcelPackage $pkg -Show:$Show
|
||||
}
|
||||
}
|
||||
|
||||
$Excel.Save()
|
||||
$Excel.Dispose()
|
||||
}
|
||||
|
||||
|
||||
Import-Module .\ImportExcel.psd1 -Force
|
||||
|
||||
$names = Get-ExcelSheetInfo C:\Temp\testDelete.xlsx
|
||||
$names | Foreach-Object { Remove-WorkSheet C:\Temp\testDelete.xlsx $_.Name}
|
||||
|
||||
##Remove-WorkSheet C:\Temp\testDelete.xlsx sheet6
|
||||
}
|
||||
@@ -130,16 +130,27 @@
|
||||
C:\> Send-SQLDataToExcel -MsSQLserver -Connection localhost -SQL "select name,type,type_desc from [master].[sys].[all_objects]" -Path .\temp.xlsx -WorkSheetname master -AutoSize -FreezeTopRow -AutoFilter -BoldTopRow
|
||||
|
||||
Connects to the local SQL server and selects 3 columns from [Sys].[all_objects] and exports then to a sheet named master with some basic header management
|
||||
.EXAMPLE
|
||||
C:\> $SQL="SELECT top 25 Name,Length From TestData ORDER BY Length DESC"
|
||||
C:\> $Connection = ' Driver={Microsoft Access Driver (*.mdb, *.accdb)};Dbq=C:\Users\James\Documents\Database1.accdb;'
|
||||
|
||||
C:\> Send-SQLDataToExcel -Connection $connection -SQL $sql -path .\demo1.xlsx -WorkSheetname "Sizes" -AutoSize
|
||||
|
||||
This declares a SQL statement and creates an ODBC connection string to read from an Access file and extracts data from it and sends it to a new worksheet
|
||||
|
||||
.EXAMPLE
|
||||
C:\> $SQL="SELECT top 25 DriverName, Count(RaceDate) as Races, Count(Win) as Wins, Count(Pole) as Poles, Count(FastestLap) as Fastlaps FROM Results GROUP BY DriverName ORDER BY (count(win)) DESC"
|
||||
C:\> $Connection = 'Driver={Microsoft Excel Driver (*.xls, *.xlsx, *.xlsm, *.xlsb)};DriverId=790;ReadOnly=0;Dbq=C:\users\James\Documents\f1Results.xlsx;'
|
||||
C:\> Send-SQLDataToExcel -Connection $connection -SQL $sql -path .\demo1.xlsx -WorkSheetname "Winners" -AutoSize -AutoNameRange
|
||||
C:\> $Connection = 'Driver={Microsoft Excel Driver (*.xls, *.xlsx, *.xlsm, *.xlsb)};Dbq=C:\users\James\Documents\f1Results.xlsx;'
|
||||
|
||||
C:\> Send-SQLDataToExcel -Connection $connection -SQL $sql -path .\demo1.xlsx -WorkSheetname "Winners" -AutoSize -AutoNameRange -ConditionalFormat @{DataBarColor="Blue"; Range="Wins"}
|
||||
|
||||
This declares a SQL statement and creates an ODBC connection string to read from an Excel file, it then runs the statement and outputs the resulting data to a new spreadsheet.
|
||||
The spreadsheet is formatted and a data bar added to show make the drivers' wins clearer.
|
||||
(the F1 results database is available from https://1drv.ms/x/s!AhfYu7-CJv4ehNdZWxJE9LMAX_N5sg )
|
||||
.EXAMPLE
|
||||
C:\> $SQL = "SELECT top 25 DriverName, Count(RaceDate) as Races, Count(Win) as Wins, Count(Pole) as Poles, Count(FastestLap) as Fastlaps FROM Results GROUP BY DriverName ORDER BY (count(win)) DESC"
|
||||
C:\> Get-SQL -Session F1 -excel -Connection "C:\Users\mcp\OneDrive\public\f1\f1Results.xlsx" -sql $sql -OutputVariable Table | out-null
|
||||
|
||||
C:\> Send-SQLDataToExcel -DataTable $Table -Path ".\demo3.xlsx" -WorkSheetname Gpwinners -autosize -TableName winners -TableStyle Light6 -show
|
||||
|
||||
This uses Get-SQL (at least V1.1 - download from the gallery with Install-Module -Name GetSQL - note the function is Get-SQL the module is GetSQL without the "-" )
|
||||
@@ -185,7 +196,7 @@
|
||||
[OfficeOpenXml.Style.ExcelFillStyle]$TitleFillPattern = 'None',
|
||||
[Switch]$TitleBold,
|
||||
[Int]$TitleSize = 22,
|
||||
[System.Drawing.Color]$TitleBackgroundColor,
|
||||
$TitleBackgroundColor,
|
||||
[String]$Password,
|
||||
[Hashtable]$PivotTableDefinition,
|
||||
[Switch]$IncludePivotTable,
|
||||
|
||||
@@ -4,9 +4,9 @@
|
||||
$Row,
|
||||
$LastColumn,
|
||||
[OfficeOpenXml.Style.ExcelFillStyle]$Pattern,
|
||||
[System.Drawing.Color]$Color
|
||||
$Color
|
||||
)
|
||||
|
||||
if ($Color -is [string]) {$Color = [System.Drawing.Color]::$Color }
|
||||
$t=$WorkSheet.Cells["A$($Row):$($LastColumn)$($Row)"]
|
||||
$t.Style.Fill.PatternType=$Pattern
|
||||
$t.Style.Fill.BackgroundColor.SetColor($Color)
|
||||
|
||||
@@ -1,47 +1,57 @@
|
||||
Function Set-ExcelColumn {
|
||||
<#
|
||||
.SYNOPSIS
|
||||
Adds or modifies a column in an Excel sheet, filling values, settings formatting and/or creating named ranges.
|
||||
Adds or modifies a column in an Excel worksheet, filling values, setting formatting and/or creating named ranges.
|
||||
.DESCRIPTION
|
||||
Set-ExcelColumn can take a value which is either a string containing a value or formula or a scriptblock
|
||||
which evaluates to a string, and optionally a column number and fills that value down the column.
|
||||
Set-ExcelColumn can take a value which is either a string containing a
|
||||
value or formula or a scriptblock which evaluates to a string,
|
||||
and optionally a column number and fills that value down the column.
|
||||
A column heading can be specified, and the column can be made a named range.
|
||||
The column can be formatted in the same operation.
|
||||
.EXAMPLE
|
||||
Set-ExcelColumn -Worksheet $ws -Column 5 -NumberFormat 'Currency'
|
||||
|
||||
$ws contains a worksheet object - and column E is set to use the local currency format.
|
||||
Intelisense will complete predefined number formats. You can see how currency is interpreted on the local computer with the command
|
||||
$ws contains a worksheet object - and column "E" is set to use the
|
||||
local currency format. Intelisense will complete the names of predefined
|
||||
number formats. You can see how currency is interpreted on the
|
||||
local computer with the command
|
||||
Expand-NumberFormat currency
|
||||
.EXAMPLE
|
||||
Set-ExcelColumn -Worksheet $ws -Heading "WinsToFastLaps" -Value {"=E$row/C$row"} -Column 7 -AutoSize -AutoNameRange
|
||||
|
||||
Here, $WS already contains a worksheet which contains counts of races won and fastest laps recorded by racing drivers (in columns C and E).
|
||||
Set-ExcelColumn specifies that Column 7 should have a heading of "WinsToFastLaps" and the data cells should contain =E2/C2 , =E3/C3 etc
|
||||
the new data cells should become a named range, which will also be named "WinsToFastLaps" the column width will be set automatically.
|
||||
.EXAMPLE.
|
||||
Here, $WS already contains a worksheet which holds counts of races won
|
||||
and fastest laps recorded by racing drivers (in columns C and E).
|
||||
Set-ExcelColumn specifies that Column 7 should have a heading of
|
||||
"WinsToFastLaps" and the data cells should contain =E2/C2 , =E3/C3 etc
|
||||
the new data cells should become a named range, which will also be
|
||||
named "WinsToFastLaps" and the column width will be set automatically.
|
||||
.EXAMPLE
|
||||
Set-ExcelColumn -Worksheet $ws -Heading "Link" -Value {"https://en.wikipedia.org" + $worksheet.cells["B$Row"].value } -AutoSize
|
||||
|
||||
In this example, the worksheet in $ws has partial links to wikipedia pages in column B.
|
||||
The -Value parameter is is a script block and it outputs a string which begins https... and ends with the value of cell at
|
||||
column B in the current row. When given a valid URI, Set-ExcelColumn makes it a hyperlink. The column will be autosized to fit the links.
|
||||
In this example, the worksheet in $ws has partial links to Wikipedia
|
||||
pages in column B. The -Value parameter is a script block which
|
||||
outputs a string beginning "https..." and ending with the value of
|
||||
the cell at column B in the current row.
|
||||
When given a valid URI, Set-ExcelColumn makes it a hyperlink.
|
||||
The column will be autosized to fit the links.
|
||||
.EXAMPLE
|
||||
4..6 | Set-ExcelColumn -Worksheet $ws -AutoNameRange
|
||||
|
||||
Again $ws contains a worksheet. Here columns 4 to 6 are made into named ranges, row 1 is used for the range name
|
||||
Again $ws contains a worksheet. Here columns 4 to 6 are made into
|
||||
named ranges, row 1 is used for the range name
|
||||
and the rest of the column becomes the range.
|
||||
#>
|
||||
[cmdletbinding()]
|
||||
[Alias("Set-Column")]
|
||||
[OutputType([OfficeOpenXml.ExcelColumn],[String])]
|
||||
Param (
|
||||
#If specifying the worksheet by name, the ExcelPackage object which contains the Sheet also needs to be passed.
|
||||
#If specifying the worksheet by name, the ExcelPackage object which contains the worksheet also needs to be passed.
|
||||
[Parameter(ParameterSetName="Package",Mandatory=$true)]
|
||||
[OfficeOpenXml.ExcelPackage]$ExcelPackage,
|
||||
#The sheet to update can be a given as a name or an Excel Worksheet object - this sets it by name.
|
||||
#The sheet to update can be given as a name or an Excel Worksheet object - this sets it by name.
|
||||
[Parameter(ParameterSetName="Package")]
|
||||
[String]$Worksheetname = "Sheet1",
|
||||
#This passes the worksheet object instead of passing a sheet name and a package.
|
||||
#This passes the worksheet object instead of passing a sheet name and an Excelpackage object.
|
||||
[Parameter(ParameterSetName="sheet",Mandatory=$true)]
|
||||
[OfficeOpenXml.ExcelWorksheet]$Worksheet,
|
||||
#Column to fill down - the first column is 1. 0 will be interpreted as first empty column.
|
||||
@@ -61,16 +71,16 @@
|
||||
#Style of border to draw around the row.
|
||||
[OfficeOpenXml.Style.ExcelBorderStyle]$BorderAround,
|
||||
#Colour for the text - if none specified it will be left as it it is.
|
||||
[System.Drawing.Color]$FontColor,
|
||||
$FontColor,
|
||||
#Make text bold; use -Bold:$false to remove bold.
|
||||
[Switch]$Bold,
|
||||
#Make text italic; use -Italic:$false to remove italic.
|
||||
[Switch]$Italic,
|
||||
#Underline the text using the underline style in -UnderlineType; use -Underline:$false to remove underlining.
|
||||
[Switch]$Underline,
|
||||
#Should Underline use single or double, normal or accounting mode ? the default is single normal.
|
||||
#Specifies whether underlining should be single or double, normal or accounting mode. The default is "Single".
|
||||
[OfficeOpenXml.Style.ExcelUnderLineType]$UnderLineType = [OfficeOpenXml.Style.ExcelUnderLineType]::Single,
|
||||
#Strike through text; use -Strikethru:$false to remove Strike through.
|
||||
#Strike through text; use -StrikeThru:$false to remove strike through.
|
||||
[Switch]$StrikeThru,
|
||||
#Subscript or Superscript (or None).
|
||||
[OfficeOpenXml.Style.ExcelVerticalAlignmentFont]$FontShift,
|
||||
@@ -79,39 +89,44 @@
|
||||
#Point size for the text.
|
||||
[float]$FontSize,
|
||||
#Change background color.
|
||||
[System.Drawing.Color]$BackgroundColor,
|
||||
#Background pattern - Solid by default.
|
||||
$BackgroundColor,
|
||||
#Background pattern - "Solid" by default.
|
||||
[OfficeOpenXml.Style.ExcelFillStyle]$BackgroundPattern = [OfficeOpenXml.Style.ExcelFillStyle]::Solid ,
|
||||
#Secondary color for background pattern.
|
||||
[Alias("PatternColour")]
|
||||
[System.Drawing.Color]$PatternColor,
|
||||
#Turn on text wrapping; use -WrapText:$false to turn off word wrapping.
|
||||
$PatternColor,
|
||||
#Turn on Text-Wrapping; use -WrapText:$false to turn off wrapping.
|
||||
[Switch]$WrapText,
|
||||
#Position cell contents to Left, Right, Center etc. Default is 'General'.
|
||||
#Position cell contents to Left, Right, Center etc. Default is "General".
|
||||
[OfficeOpenXml.Style.ExcelHorizontalAlignment]$HorizontalAlignment,
|
||||
#Position cell contents to Top, Bottom or Center.
|
||||
[OfficeOpenXml.Style.ExcelVerticalAlignment]$VerticalAlignment,
|
||||
#Degrees to rotate text. Up to +90 for anti-clockwise ("upwards"), or to -90 for clockwise.
|
||||
[ValidateRange(-90, 90)]
|
||||
[int]$TextRotation ,
|
||||
#Autofit cells to width.
|
||||
#Attempt to auto-fit cells to the width their contents.
|
||||
[Alias("AutoFit")]
|
||||
[Switch]$AutoSize,
|
||||
#Set cells to a fixed width, ignored if -Autosize is specified.
|
||||
#Set cells to a fixed width, ignored if -AutoSize is specified.
|
||||
[float]$Width,
|
||||
#Set the inserted data to be a named range.
|
||||
[Switch]$AutoNameRange,
|
||||
#Hide the column.
|
||||
[Switch]$Hide,
|
||||
#If Sepecified, returns the range of cells which were affected.
|
||||
#If specified, returns the range of cells which were affected.
|
||||
[Switch]$Specified,
|
||||
#If Specified, return the Column to allow further work to be done on it.
|
||||
#If specified, return an object representing the Column, to allow further work to be done on it.
|
||||
[Switch]$PassThru
|
||||
)
|
||||
|
||||
begin {
|
||||
#if we were passed a package object and a worksheet name , get the worksheet.
|
||||
if ($ExcelPackage) {$Worksheet = $ExcelPackage.Workbook.Worksheets[$Worksheetname] }
|
||||
if ($ExcelPackage) {
|
||||
if ($ExcelPackage.Workbook.Worksheets.Name -notcontains $Worksheetname) {
|
||||
throw "The Workbook does not contain a sheet named '$Worksheetname'"
|
||||
}
|
||||
else {$Worksheet = $ExcelPackage.Workbook.Worksheets[$Worksheetname] }
|
||||
}
|
||||
|
||||
#In a script block to build a formula, we may want any of corners or the column name,
|
||||
#if Column and Startrow aren't specified, assume first unused column, and first row
|
||||
@@ -121,6 +136,7 @@
|
||||
$endRow = $Worksheet.Dimension.End.Row
|
||||
}
|
||||
process {
|
||||
if ($null -eq $workSheet.Dimension) {Write-Warning "Can't format an empty worksheet."; return}
|
||||
if ($Column -eq 0 ) {$Column = $endColumn + 1 }
|
||||
$columnName = [OfficeOpenXml.ExcelCellAddress]::new(1,$column).Address -replace "1",""
|
||||
Write-Verbose -Message "Updating Column $columnName"
|
||||
@@ -136,14 +152,15 @@
|
||||
Add-ExcelName -Range $Worksheet.Cells[($StartRow+1), $Column, $endRow, $Column] -RangeName $Worksheet.Cells[$StartRow, $Column].Value
|
||||
}
|
||||
|
||||
#Fill in the data
|
||||
#Fill in the data -it can be zero null or and empty string.
|
||||
if ($PSBoundParameters.ContainsKey('Value')) { foreach ($row in ($StartRow..$endRow)) {
|
||||
if ($Value -is [scriptblock]) { #re-create the script block otherwise variables from this function are out of scope.
|
||||
$cellData = & ([scriptblock]::create( $Value ))
|
||||
Write-Verbose -Message $cellData
|
||||
if ($null -eq $cellData) {Write-Verbose -Message "Script block evaluates to null."}
|
||||
else {Write-Verbose -Message "Script block evaluates to '$cellData'"}
|
||||
}
|
||||
else { $cellData = $Value}
|
||||
if ($cellData -match "^=") { $Worksheet.Cells[$Row, $Column].Formula = ($cellData -replace '^=','') } #EPPlus likes formulas with no = sign; Excel doesn't care
|
||||
if ($cellData -match "^=") { $Worksheet.Cells[$Row, $Column].Formula = ($cellData -replace '^=','') } #EPPlus likes formulas with no = sign; Excel doesn't care
|
||||
elseif ( [System.Uri]::IsWellFormedUriString($cellData , [System.UriKind]::Absolute)) {
|
||||
# Save a hyperlink : internal links can be in the form xl://sheet!E419 (use A1 as goto sheet), or xl://RangeName
|
||||
if ($cellData -match "^xl://internal/") {
|
||||
@@ -152,18 +169,18 @@
|
||||
$h = New-Object -TypeName OfficeOpenXml.ExcelHyperLink -ArgumentList $referenceAddress , $display
|
||||
$Worksheet.Cells[$Row, $Column].HyperLink = $h
|
||||
}
|
||||
else {$Worksheet.Cells[$Row, $Column].HyperLink = $cellData }
|
||||
$Worksheet.Cells[$Row, $Column].Style.Font.Color.SetColor([System.Drawing.Color]::Blue)
|
||||
else {$Worksheet.Cells[$Row, $Column].HyperLink = $cellData }
|
||||
$Worksheet.Cells[$Row, $Column].Style.Font.UnderLine = $true
|
||||
$Worksheet.Cells[$Row, $Column].Style.Font.Color.SetColor([System.Drawing.Color]::Blue)
|
||||
}
|
||||
else { $Worksheet.Cells[$Row, $Column].Value = $cellData }
|
||||
if ($cellData -is [datetime]) { $Worksheet.Cells[$Row, $Column].Style.Numberformat.Format = 'm/d/yy h:mm' } # This is not a custom format, but a preset recognized as date and localized.
|
||||
if ($cellData -is [timespan]) { $Worksheet.Cells[$Row, $Column].Style.Numberformat.Format = '[h]:mm:ss' }
|
||||
}}
|
||||
|
||||
#region Apply formatting
|
||||
$params = @{}
|
||||
foreach ($p in @('Underline','Bold','Italic','StrikeThru','FontSize','FontShift','NumberFormat','TextRotation',
|
||||
foreach ($p in @('Underline','Bold','Italic','StrikeThru', 'FontName', 'FontSize','FontShift','NumberFormat','TextRotation',
|
||||
'WrapText', 'HorizontalAlignment','VerticalAlignment', 'Autosize', 'Width', 'FontColor'
|
||||
'BorderAround', 'BackgroundColor', 'BackgroundPattern', 'PatternColor')) {
|
||||
if ($PSBoundParameters.ContainsKey($p)) {$params[$p] = $PSBoundParameters[$p]}
|
||||
|
||||
82
Set-Row.ps1
82
Set-Row.ps1
@@ -1,32 +1,40 @@
|
||||
Function Set-ExcelRow {
|
||||
<#
|
||||
.Synopsis
|
||||
Fills values into a [new] row in an Excel spreadsheet. And sets row formats.
|
||||
Fills values into a [new] row in an Excel spreadsheet, and sets row formats.
|
||||
.Description
|
||||
Set-ExcelRow accepts either a Worksheet object or an Excel Package object returned by Export-Excel and the name of a sheet,
|
||||
and inserts the chosen contents into a row of the sheet.
|
||||
The contents can be a constant e.g. "42", a formula or a script block which is converted into a constant or a formula.
|
||||
Set-ExcelRow accepts either a Worksheet object or an ExcelPackage object
|
||||
returned by Export-Excel and the name of a sheet, and inserts the chosen
|
||||
contents into a row of the sheet. The contents can be a constant,
|
||||
like "42", a formula or a script block which is converted into a
|
||||
constant or a formula.
|
||||
The first cell of the row can optionally be given a heading.
|
||||
.Example
|
||||
Set-ExcelRow -Worksheet $ws -Heading Total -Value {"=sum($columnName`2:$columnName$endrow)" }
|
||||
Set-ExcelRow -Worksheet $ws -Heading Total -Value {"=sum($columnName`2:$columnName$endrow)" }
|
||||
|
||||
$Ws contains a worksheet object, and no Row number is specified so Set-ExcelRow will select the next row after the end
|
||||
of the data in the sheet. The first cell in the row will contain "Total", and each other cell will contain
|
||||
=Sum(xx2:xx99) - where xx is the column name, and 99 is the last row of data.
|
||||
Note the use of `2 to Prevent 2 becoming part of the variable "ColumnName"
|
||||
The script block can use $Worksheet, $Row, $Column (number), $ColumnName (letter), $StartRow/Column and $EndRow/Column
|
||||
$Ws contains a worksheet object, and no Row number is specified so
|
||||
Set-ExcelRow will select the next row after the endof the data in
|
||||
the sheet. The first cell in the row will contain "Total", and
|
||||
each of the other cells will contain
|
||||
=Sum(xx2:xx99)
|
||||
where xx is the column name, and 99 is the last row of data.
|
||||
Note the use of `2 to Prevent 2 becoming part of the variable "ColumnName"
|
||||
The script block can use $Worksheet, $Row, $Column (number),
|
||||
$ColumnName (letter), $StartRow/Column and $EndRow/Column.
|
||||
.Example
|
||||
Set-ExcelRow -Worksheet $ws -Heading Total -HeadingBold -Value {"=sum($columnName`2:$columnName$endrow)" } -NumberFormat 'Currency' -StartColumn 2 -Bold -BorderTop Double -BorderBottom Thin
|
||||
|
||||
This builds on the previous example, but this time the label "Total" appears in column 2 and the formula fills from column 3 onwards;
|
||||
the formula and heading are set in bold face, and the formula is formatted for the local currency,
|
||||
and given a double line border above and single line border below.
|
||||
This builds on the previous example, but this time the label "Total"
|
||||
appears in column 2 and the formula fills from column 3 onwards.
|
||||
The formula and heading are set in bold face, and the formula is
|
||||
formatted for the local currency, and given a double line border
|
||||
above and single line border below.
|
||||
#>
|
||||
[cmdletbinding()]
|
||||
[Alias("Set-Row")]
|
||||
[OutputType([OfficeOpenXml.ExcelRow],[String])]
|
||||
Param (
|
||||
#An Excel package object - e.g. from Export-Excel -passthru - requires a sheet name.
|
||||
#An Excel package object - e.g. from Export-Excel -PassThru - requires a sheet name.
|
||||
[Parameter(ParameterSetName="Package",Mandatory=$true)]
|
||||
[OfficeOpenXml.ExcelPackage]$ExcelPackage,
|
||||
#The name of the sheet to update in the package.
|
||||
@@ -40,21 +48,21 @@
|
||||
$Row = 0 ,
|
||||
#Position in the row to start from.
|
||||
[int]$StartColumn,
|
||||
#Value, formula or script block to fill in. Script block can use $worksheet, $row, $Column [number], $ColumnName [letter(s)], $startRow, $startColumn, $endRow, $endColumn
|
||||
#Value, Formula or ScriptBlock to fill in. A ScriptBlock can use $worksheet, $row, $Column [number], $ColumnName [letter(s)], $startRow, $startColumn, $endRow, $endColumn.
|
||||
$Value,
|
||||
#Optional Row heading.
|
||||
#Optional row-heading.
|
||||
$Heading ,
|
||||
#Set the heading in bold type.
|
||||
[Switch]$HeadingBold,
|
||||
#Change the size of the heading type.
|
||||
#Change the font-size of the heading.
|
||||
[Int]$HeadingSize ,
|
||||
#Number format to apply to cells e.g. "dd/MM/yyyy HH:mm", "£#,##0.00;[Red]-£#,##0.00", "0.00%" , "##/##" , "0.0E+0" etc.
|
||||
[Alias("NFormat")]
|
||||
$NumberFormat,
|
||||
#Style of border to draw around the row.
|
||||
[OfficeOpenXml.Style.ExcelBorderStyle]$BorderAround,
|
||||
#Color of the border
|
||||
[System.Drawing.Color]$BorderColor=[System.Drawing.Color]::Black,
|
||||
#Color of the border.
|
||||
$BorderColor=[System.Drawing.Color]::Black,
|
||||
#Style for the bottom border.
|
||||
[OfficeOpenXml.Style.ExcelBorderStyle]$BorderBottom,
|
||||
#Style for the top border.
|
||||
@@ -63,17 +71,17 @@
|
||||
[OfficeOpenXml.Style.ExcelBorderStyle]$BorderLeft,
|
||||
#Style for the right border.
|
||||
[OfficeOpenXml.Style.ExcelBorderStyle]$BorderRight,
|
||||
#Colour for the text - if none specified it will be left as it it is.
|
||||
[System.Drawing.Color]$FontColor,
|
||||
#Color for the text - if none specified it will be left as it it is.
|
||||
$FontColor,
|
||||
#Make text bold; use -Bold:$false to remove bold.
|
||||
[Switch]$Bold,
|
||||
#Make text italic; use -Italic:$false to remove italic.
|
||||
[Switch]$Italic,
|
||||
#Underline the text using the underline style in -UnderlineType; use -Underline:$false to remove underlining.
|
||||
[Switch]$Underline,
|
||||
#Should Underline use single or double, normal or accounting mode : default is single normal.
|
||||
#Specifies whether underlining should be single or double, normal or accounting mode. The default is "Single".
|
||||
[OfficeOpenXml.Style.ExcelUnderLineType]$UnderLineType = [OfficeOpenXml.Style.ExcelUnderLineType]::Single,
|
||||
#Strike through text; use -Strikethru:$false to remove Strike through.
|
||||
#Strike through text; use -StrikeThru:$false to remove strike through.
|
||||
[Switch]$StrikeThru,
|
||||
#Subscript or Superscript (or none).
|
||||
[OfficeOpenXml.Style.ExcelVerticalAlignmentFont]$FontShift,
|
||||
@@ -82,34 +90,38 @@
|
||||
#Point size for the text.
|
||||
[float]$FontSize,
|
||||
#Change background color.
|
||||
[System.Drawing.Color]$BackgroundColor,
|
||||
$BackgroundColor,
|
||||
#Background pattern - solid by default.
|
||||
[OfficeOpenXml.Style.ExcelFillStyle]$BackgroundPattern = [OfficeOpenXml.Style.ExcelFillStyle]::Solid ,
|
||||
#Secondary color for background pattern.
|
||||
[Alias("PatternColour")]
|
||||
[System.Drawing.Color]$PatternColor,
|
||||
#Turn on text wrapping; use -WrapText:$false to turn off word wrapping.
|
||||
$PatternColor,
|
||||
#Turn on Text-Wrapping; use -WrapText:$false to turn off wrapping.
|
||||
[Switch]$WrapText,
|
||||
#Position cell contents to Left, Right, Center etc. default is 'General'.
|
||||
[OfficeOpenXml.Style.ExcelHorizontalAlignment]$HorizontalAlignment,
|
||||
#Position cell contents to Top Bottom or Center.
|
||||
#Position cell contents to Top, Bottom or Center.
|
||||
[OfficeOpenXml.Style.ExcelVerticalAlignment]$VerticalAlignment,
|
||||
#Degrees to rotate text. Up to +90 for anti-clockwise ("upwards"), or to -90 for clockwise.
|
||||
[ValidateRange(-90, 90)]
|
||||
[int]$TextRotation ,
|
||||
#Set cells to a fixed hieght.
|
||||
#Set cells to a fixed height.
|
||||
[float]$Height,
|
||||
#Hide the Row.
|
||||
#Hide the row.
|
||||
[Switch]$Hide,
|
||||
#If Sepecified returns the range of cells which were affected.
|
||||
#If sepecified, returns the range of cells which were affected.
|
||||
[Switch]$ReturnRange,
|
||||
#If Specified, return a row object to allow further work to be done.
|
||||
[Switch]$PassThru
|
||||
)
|
||||
begin {
|
||||
#if we were passed a package object and a worksheet name , get the worksheet.
|
||||
if ($ExcelPackage) {$Worksheet = $ExcelPackage.Workbook.worksheets[$Worksheetname] }
|
||||
|
||||
if ($ExcelPackage) {
|
||||
if ($ExcelPackage.Workbook.Worksheets.Name -notcontains $Worksheetname) {
|
||||
throw "The Workbook does not contain a sheet named '$Worksheetname'"
|
||||
}
|
||||
else {$Worksheet = $ExcelPackage.Workbook.Worksheets[$Worksheetname] }
|
||||
}
|
||||
#In a script block to build a formula, we may want any of corners or the columnname,
|
||||
#if row and start column aren't specified assume first unused row, and first column
|
||||
if (-not $StartColumn) {$StartColumn = $Worksheet.Dimension.Start.Column }
|
||||
@@ -118,6 +130,7 @@
|
||||
$endRow = $Worksheet.Dimension.End.Row
|
||||
}
|
||||
process {
|
||||
if ($null -eq $workSheet.Dimension) {Write-Warning "Can't format an empty worksheet."; return}
|
||||
if ($Row -eq 0 ) {$Row = $endRow + 1 }
|
||||
Write-Verbose -Message "Updating Row $Row"
|
||||
#Add a row label
|
||||
@@ -134,7 +147,8 @@
|
||||
if ($Value -is [scriptblock] ) {
|
||||
#re-create the script block otherwise variables from this function are out of scope.
|
||||
$cellData = & ([scriptblock]::create( $Value ))
|
||||
Write-Verbose -Message $cellData
|
||||
if ($null -eq $cellData) {Write-Verbose -Message "Script block evaluates to null."}
|
||||
else {Write-Verbose -Message "Script block evaluates to '$cellData'"}
|
||||
}
|
||||
else{$cellData = $Value}
|
||||
if ($cellData -match "^=") { $Worksheet.Cells[$Row, $column].Formula = ($cellData -replace '^=','') } #EPPlus likes formulas with no = sign; Excel doesn't care
|
||||
@@ -156,7 +170,7 @@
|
||||
}}
|
||||
#region Apply formatting
|
||||
$params = @{}
|
||||
foreach ($p in @('Underline','Bold','Italic','StrikeThru','FontSize', 'FontShift','NumberFormat','TextRotation',
|
||||
foreach ($p in @('Underline','Bold','Italic','StrikeThru', 'FontName', 'FontSize', 'FontShift','NumberFormat','TextRotation',
|
||||
'WrapText', 'HorizontalAlignment','VerticalAlignment', 'Height', 'FontColor'
|
||||
'BorderAround', 'BorderBottom', 'BorderTop', 'BorderLeft', 'BorderRight', 'BorderColor',
|
||||
'BackgroundColor', 'BackgroundPattern', 'PatternColor')) {
|
||||
|
||||
@@ -1,27 +1,34 @@
|
||||
Function Set-ExcelRange {
|
||||
<#
|
||||
.SYNOPSIS
|
||||
Applies Number, font, alignment and color formatting, values or formulas to a range of Excel Cells.
|
||||
Applies number, font, alignment and/or color formatting, values or formulas to a range of Excel cells.
|
||||
.DESCRIPTION
|
||||
Set-ExcelRange was created to set the style elements for a range of cells, this includes
|
||||
auto-sizing and hiding, setting font elements (Name, Size, Bold, Italic, Underline & UnderlineStyle and Subscript & SuperScript),
|
||||
font and background colors, borders, text wrapping, rotation, aliginment within cells, and number format.
|
||||
It was orignally named "Set-Format",but it has been extended to set Values, Formulas and
|
||||
ArrayFormulas (sometimes called Ctrl-shift-Enter [CSE] formulas); because of this
|
||||
The name has become Set-ExcelRange - but the old name of Set-Format is preserved as an alias name.
|
||||
Set-ExcelRange was created to set the style elements for a range of cells,
|
||||
this includes auto-sizing and hiding, setting font elements (Name, Size,
|
||||
Bold, Italic, Underline & UnderlineStyle and Subscript & SuperScript),
|
||||
font and background colors, borders, text wrapping, rotation, alignment
|
||||
within cells, and number format.
|
||||
It was orignally named "Set-Format", but it has been extended to set
|
||||
Values, Formulas and ArrayFormulas (sometimes called Ctrl-shift-Enter
|
||||
[CSE] formulas); because of this, the name has become Set-ExcelRange
|
||||
but the old name of Set-Format is preserved as an alias.
|
||||
.EXAMPLE
|
||||
$sheet.Column(3) | Set-ExcelRange -HorizontalAlignment Right -NumberFormat "#,###" -AutoFit
|
||||
|
||||
Selects column 3 from a sheet object (within a workbook object, which is a child of the ExcelPackage object) and passes it to Set-ExcelRange
|
||||
which formats as an integer with comma-separated groups, aligns it right, and auto-fits the column to the contents.
|
||||
Selects column 3 from a sheet object (within a workbook object, which
|
||||
is a child of the ExcelPackage object) and passes it to Set-ExcelRange
|
||||
which formats numbers as a integers with comma-separated groups,
|
||||
aligns it right, and auto-fits the column to the contents.
|
||||
.EXAMPLE
|
||||
Set-ExcelRange -Range $sheet.Cells["E1:H1048576"] -HorizontalAlignment Right -NumberFormat "#,###"
|
||||
|
||||
Instead of piping the address, this version specifies a block of cells and applies similar formatting.
|
||||
Instead of piping the address, this version specifies a block of cells
|
||||
and applies similar formatting.
|
||||
.EXAMPLE
|
||||
Set-ExcelRange $excel.Workbook.Worksheets[1].Tables["Processes"] -Italic
|
||||
|
||||
This time instead of specifying a range of cells, a table is selected by name and formatted as italic.
|
||||
This time instead of specifying a range of cells, a table is selected
|
||||
by name and formatted as italic.
|
||||
#>
|
||||
[cmdletbinding()]
|
||||
[Alias("Set-Format")]
|
||||
@@ -38,7 +45,7 @@
|
||||
#Style of border to draw around the range.
|
||||
[OfficeOpenXml.Style.ExcelBorderStyle]$BorderAround,
|
||||
#Color of the border.
|
||||
[System.Drawing.Color]$BorderColor=[System.Drawing.Color]::Black,
|
||||
$BorderColor=[System.Drawing.Color]::Black,
|
||||
#Style for the bottom border.
|
||||
[OfficeOpenXml.Style.ExcelBorderStyle]$BorderBottom,
|
||||
#Style for the top border.
|
||||
@@ -48,22 +55,22 @@
|
||||
#Style for the right border.
|
||||
[OfficeOpenXml.Style.ExcelBorderStyle]$BorderRight,
|
||||
#Colour for the text - if none is specified it will be left as it is.
|
||||
[System.Drawing.Color]$FontColor,
|
||||
$FontColor,
|
||||
#Value for the cell.
|
||||
$Value,
|
||||
#Formula for the cell.
|
||||
$Formula,
|
||||
#Specifies formula should be an array formula (a.k.a CSE [ctrl-shift-enter] formula).
|
||||
[Switch]$ArrayFormula,
|
||||
#Clear Bold, Italic, StrikeThrough and Underline and set colour to black.
|
||||
#Clear Bold, Italic, StrikeThrough and Underline and set color to Black.
|
||||
[Switch]$ResetFont,
|
||||
#Make text bold; use -Bold:$false to remove bold.
|
||||
[Switch]$Bold,
|
||||
#Make text italic; use -Italic:$false to remove italic.
|
||||
[Switch]$Italic,
|
||||
#Underline the text using the underline style in -underline type; use -Underline:$false to remove underlining.
|
||||
#Underline the text using the underline style in -UnderlineType; use -Underline:$false to remove underlining.
|
||||
[Switch]$Underline,
|
||||
#Should Underline use single or double, normal or accounting mode: the default is single normal.
|
||||
#Specifies whether underlining should be single or double, normal or accounting mode. The default is "Single".
|
||||
[OfficeOpenXml.Style.ExcelUnderLineType]$UnderLineType = [OfficeOpenXml.Style.ExcelUnderLineType]::Single,
|
||||
#Strike through text; use -Strikethru:$false to remove Strike through
|
||||
[Switch]$StrikeThru,
|
||||
@@ -74,17 +81,17 @@
|
||||
#Point size for the text.
|
||||
[float]$FontSize,
|
||||
#Change background color.
|
||||
[System.Drawing.Color]$BackgroundColor,
|
||||
$BackgroundColor,
|
||||
#Background pattern - Solid by default.
|
||||
[OfficeOpenXml.Style.ExcelFillStyle]$BackgroundPattern = [OfficeOpenXml.Style.ExcelFillStyle]::Solid ,
|
||||
#Secondary color for background pattern.
|
||||
[Alias("PatternColour")]
|
||||
[System.Drawing.Color]$PatternColor,
|
||||
#Turn on text wrapping; use -WrapText:$false to turn off word wrapping.
|
||||
$PatternColor,
|
||||
#Turn on Text-Wrapping; use -WrapText:$false to turn off wrapping.
|
||||
[Switch]$WrapText,
|
||||
#Position cell contents to Left, Right, Center etc. default is 'General'.
|
||||
[OfficeOpenXml.Style.ExcelHorizontalAlignment]$HorizontalAlignment,
|
||||
#Position cell contents to Top Bottom or Center.
|
||||
#Position cell contents to Top, Bottom or Center.
|
||||
[OfficeOpenXml.Style.ExcelVerticalAlignment]$VerticalAlignment,
|
||||
#Degrees to rotate text. Up to +90 for anti-clockwise ("upwards"), or to -90 for clockwise.
|
||||
[ValidateRange(-90, 90)]
|
||||
@@ -94,7 +101,7 @@
|
||||
[Switch]$AutoSize,
|
||||
#Set cells to a fixed width (columns or ranges only), ignored if Autosize is specified.
|
||||
[float]$Width,
|
||||
#Set cells to a fixed hieght (rows or ranges only).
|
||||
#Set cells to a fixed height (rows or ranges only).
|
||||
[float]$Height,
|
||||
#Hide a row or column (not a range); use -Hidden:$false to unhide.
|
||||
[Switch]$Hidden
|
||||
@@ -113,7 +120,7 @@
|
||||
elseif ($Range -is [string]) {Write-Warning -Message "The range pararameter you have specified also needs a worksheet parameter."}
|
||||
|
||||
if ($ResetFont) {
|
||||
$Range.Style.Font.Color.SetColor("Black")
|
||||
$Range.Style.Font.Color.SetColor( ([System.Drawing.Color]::Black))
|
||||
$Range.Style.Font.Bold = $false
|
||||
$Range.Style.Font.Italic = $false
|
||||
$Range.Style.Font.UnderLine = $false
|
||||
@@ -136,10 +143,14 @@
|
||||
if ($PSBoundParameters.ContainsKey('FontSize')){
|
||||
$Range.Style.Font.Size = $FontSize
|
||||
}
|
||||
if ($PSBoundParameters.ContainsKey('FontName')){
|
||||
$Range.Style.Font.Name = $FontName
|
||||
}
|
||||
if ($PSBoundParameters.ContainsKey('FontShift')){
|
||||
$Range.Style.Font.VerticalAlign = $FontShift
|
||||
}
|
||||
if ($PSBoundParameters.ContainsKey('FontColor')){
|
||||
if ($FontColor -is [string]) {$FontColor = [System.Drawing.Color]::$FontColor }
|
||||
$Range.Style.Font.Color.SetColor( $FontColor)
|
||||
}
|
||||
if ($PSBoundParameters.ContainsKey('TextRotation')) {
|
||||
@@ -169,6 +180,7 @@
|
||||
if ($PSBoundParameters.ContainsKey('NumberFormat')) {
|
||||
$Range.Style.Numberformat.Format = (Expand-NumberFormat $NumberFormat)
|
||||
}
|
||||
if ($BorderColor -is [string]) {$BorderColor = [System.Drawing.Color]::$BorderColor }
|
||||
if ($PSBoundParameters.ContainsKey('BorderAround')) {
|
||||
$Range.Style.Border.BorderAround($BorderAround, $BorderColor)
|
||||
}
|
||||
@@ -190,8 +202,10 @@
|
||||
}
|
||||
if ($PSBoundParameters.ContainsKey('BackgroundColor')) {
|
||||
$Range.Style.Fill.PatternType = $BackgroundPattern
|
||||
if ($BackgroundColor -is [string]) {$BackgroundColor = [System.Drawing.Color]::$BackgroundColor }
|
||||
$Range.Style.Fill.BackgroundColor.SetColor($BackgroundColor)
|
||||
if ($PatternColor) {
|
||||
if ($PatternColor -is [string]) {$PatternColor = [System.Drawing.Color]::$PatternColor }
|
||||
$Range.Style.Fill.PatternColor.SetColor( $PatternColor)
|
||||
}
|
||||
}
|
||||
@@ -288,12 +302,15 @@ if (Get-Command -ErrorAction SilentlyContinue -name Register-ArgumentCompleter)
|
||||
Function Expand-NumberFormat {
|
||||
<#
|
||||
.SYNOPSIS
|
||||
Converts short names for Number formats to the formatting strings used in Excel
|
||||
Converts short names for number formats to the formatting strings used in Excel
|
||||
.DESCRIPTION
|
||||
Where you can type a number format you can write, for example 'Short-Date' and the module will translate it into the format string used by excel
|
||||
Some formats, like Short-Date change how they are presented when Excel loads. (So date will use the local ordering of year, month and Day)
|
||||
Other formats change how they appear when loaded with different cultures (depending on the country "," or "." or " " may be the thousand seperator
|
||||
although excel always stores it as ",")
|
||||
Where you can type a number format you can write, for example, 'Short-Date'
|
||||
and the module will translate it into the format string used by Excel.
|
||||
Some formats, like Short-Date change how they are presented when Excel
|
||||
loads (so date will use the local ordering of year, month and Day). Other
|
||||
formats change how they appear when loaded with different cultures
|
||||
(depending on the country "," or "." or " " may be the thousand seperator
|
||||
although Excel always stores it as ",")
|
||||
.EXAMPLE
|
||||
Expand-NumberFormat percentage
|
||||
|
||||
@@ -301,11 +318,15 @@ Function Expand-NumberFormat {
|
||||
.EXAMPLE
|
||||
Expand-NumberFormat Currency
|
||||
|
||||
Returns the currency format specified in the local regional settings. This may not be the same as Excel uses
|
||||
The regional settings set the currency symbol and then whether it is before or after the number and seperated with a space or not;
|
||||
for negative numbers the number by wrapped in parentheses or a - sign might appear before or after the number and symbol.
|
||||
So this returns $#,##0.00;($#,##0.00) for English US, #,##0.00 €;€#,##0.00- for French. (Note some Eurozone countries write €1,23 and others 1,23€ )
|
||||
In French the decimal point will be rendered as a "," and the thousand seperator as a space.
|
||||
Returns the currency format specified in the local regional settings. This
|
||||
may not be the same as Excel uses. The regional settings set the currency
|
||||
symbol and then whether it is before or after the number and separated with
|
||||
a space or not; for negative numbers the number may be wrapped in parentheses
|
||||
or a - sign might appear before or after the number and symbol.
|
||||
So this returns $#,##0.00;($#,##0.00) for English US, #,##0.00 €;€#,##0.00-
|
||||
for French. (Note some Eurozone countries write €1,23 and others 1,23€ )
|
||||
In French the decimal point will be rendered as a "," and the thousand
|
||||
separator as a space.
|
||||
#>
|
||||
[cmdletbinding()]
|
||||
[OutputType([String])]
|
||||
|
||||
@@ -1,13 +1,12 @@
|
||||
#Requires -Modules Pester
|
||||
Import-Module $PSScriptRoot\..\ImportExcel.psd1 -Force
|
||||
|
||||
Add-Type -AssemblyName System.Windows.Forms
|
||||
|
||||
if ($PSVersionTable.PSVersion.Major -gt 5) { Write-Warning "Can't test grid view on V6" }
|
||||
else {Add-Type -AssemblyName System.Windows.Forms }
|
||||
Describe "Compare Worksheet" {
|
||||
Context "Simple comparison output" {
|
||||
BeforeAll {
|
||||
Remove-Item -Path "$env:temp\server*.xlsx"
|
||||
[System.Collections.ArrayList]$s = get-service | Select-Object -first 25 -Property *
|
||||
[System.Collections.ArrayList]$s = get-service | Select-Object -first 25 -Property Name, RequiredServices, CanPauseAndContinue, CanShutdown, CanStop, DisplayName, DependentServices, MachineName
|
||||
$s | Export-Excel -Path $env:temp\server1.xlsx
|
||||
#$s is a zero based array, excel rows are 1 based and excel has a header row so Excel rows will be 2 + index in $s
|
||||
$row4Displayname = $s[2].DisplayName
|
||||
@@ -51,8 +50,9 @@ Describe "Compare Worksheet" {
|
||||
|
||||
Context "Setting the background to highlight different rows, use of grid view." {
|
||||
BeforeAll {
|
||||
Compare-WorkSheet "$env:temp\Server1.xlsx" "$env:temp\Server2.xlsx" -BackgroundColor LightGreen -GridView
|
||||
Start-Sleep -sec 5; [System.Windows.Forms.SendKeys]::Sendwait("%{F4}")
|
||||
$useGrid = ($PSVersionTable.PSVersion.Major -LE 5)
|
||||
$null = Compare-WorkSheet "$env:temp\Server1.xlsx" "$env:temp\Server2.xlsx" -BackgroundColor ([System.Drawing.Color]::LightGreen) -GridView:$useGrid
|
||||
if ($useGrid) {Start-Sleep -sec 5; [System.Windows.Forms.SendKeys]::Sendwait("%{F4}") }
|
||||
$xl1 = Open-ExcelPackage -Path "$env:temp\Server1.xlsx"
|
||||
$xl2 = Open-ExcelPackage -Path "$env:temp\Server2.xlsx"
|
||||
$s1Sheet = $xl1.Workbook.Worksheets[1]
|
||||
@@ -78,7 +78,7 @@ Describe "Compare Worksheet" {
|
||||
|
||||
Context "Setting the forgound to highlight changed properties" {
|
||||
BeforeAll {
|
||||
$null = compare-WorkSheet "$env:temp\Server1.xlsx" "$env:temp\Server2.xlsx" -AllDataBackgroundColor white -BackgroundColor LightGreen -FontColor DarkRed
|
||||
$null = compare-WorkSheet "$env:temp\Server1.xlsx" "$env:temp\Server2.xlsx" -AllDataBackgroundColor([System.Drawing.Color]::white) -BackgroundColor ([System.Drawing.Color]::LightGreen) -FontColor ([System.Drawing.Color]::DarkRed)
|
||||
$xl1 = Open-ExcelPackage -Path "$env:temp\Server1.xlsx"
|
||||
$xl2 = Open-ExcelPackage -Path "$env:temp\Server2.xlsx"
|
||||
$s1Sheet = $xl1.Workbook.Worksheets[1]
|
||||
@@ -107,7 +107,8 @@ Describe "Compare Worksheet" {
|
||||
|
||||
Context "More complex comparison: output check and different worksheet names " {
|
||||
BeforeAll {
|
||||
[System.Collections.ArrayList]$s = get-service | Select-Object -first 25 -Property * -ExcludeProperty Name
|
||||
[System.Collections.ArrayList]$s = get-service | Select-Object -first 25 -Property RequiredServices, CanPauseAndContinue, CanShutdown, CanStop,
|
||||
DisplayName, DependentServices, MachineName, ServiceName, ServicesDependedOn, ServiceHandle, Status, ServiceType, StartType -ExcludeProperty Name
|
||||
$s | Export-Excel -Path $env:temp\server1.xlsx -WorkSheetname Server1
|
||||
#$s is a zero based array, excel rows are 1 based and excel has a header row so Excel rows will be 2 + index in $s
|
||||
$row4Displayname = $s[2].DisplayName
|
||||
@@ -119,9 +120,10 @@ Describe "Compare Worksheet" {
|
||||
$row6Name = $s[5].ServiceName
|
||||
$s.RemoveAt(5)
|
||||
$s[10].ServiceType = "Changed should not matter"
|
||||
|
||||
$s | Select-Object -Property ServiceName, DisplayName, StartType, ServiceType | Export-Excel -Path $env:temp\server2.xlsx -WorkSheetname server2
|
||||
#Assume default worksheet name, (sheet1) and column header for key ("name")
|
||||
$comp = compare-WorkSheet "$env:temp\Server1.xlsx" "$env:temp\Server2.xlsx" -WorkSheetName Server1,Server2 -Key ServiceName -Property DisplayName,StartType -AllDataBackgroundColor AliceBlue -BackgroundColor White -FontColor Red | Sort-Object _row,_file
|
||||
$comp = compare-WorkSheet "$env:temp\Server1.xlsx" "$env:temp\Server2.xlsx" -WorkSheetName Server1,Server2 -Key ServiceName -Property DisplayName,StartType -AllDataBackgroundColor ([System.Drawing.Color]::AliceBlue) -BackgroundColor ([System.Drawing.Color]::White) -FontColor ([System.Drawing.Color]::Red) | Sort-Object _row,_file
|
||||
$xl1 = Open-ExcelPackage -Path "$env:temp\Server1.xlsx"
|
||||
$xl2 = Open-ExcelPackage -Path "$env:temp\Server2.xlsx"
|
||||
$s1Sheet = $xl1.Workbook.Worksheets["server1"]
|
||||
@@ -170,8 +172,8 @@ Describe "Compare Worksheet" {
|
||||
$s2Sheet.Cells["F4"].Style.Font.Color.Rgb | Should beNullOrEmpty
|
||||
}
|
||||
AfterAll {
|
||||
Close-ExcelPackage -ExcelPackage $xl1 -NoSave -Show
|
||||
Close-ExcelPackage -ExcelPackage $xl2 -NoSave -Show
|
||||
# Close-ExcelPackage -ExcelPackage $xl1 -NoSave -Show
|
||||
# Close-ExcelPackage -ExcelPackage $xl2 -NoSave -Show
|
||||
}
|
||||
}
|
||||
}
|
||||
@@ -321,19 +323,21 @@ Describe "Merge Multiple sheets" {
|
||||
}
|
||||
it "Creared Conditional formatting rules " {
|
||||
$cf=$ws.ConditionalFormatting
|
||||
$cf.Count | Should be 15
|
||||
$cf[14].Address.Address | Should be 'B2:B1048576'
|
||||
$cf.Count | Should be 17
|
||||
$cf[16].Address.Address | Should be 'B2:B1048576'
|
||||
$cf[16].Type | Should be 'Expression'
|
||||
$cf[16].Formula | Should be 'OR(G2<>"Same",K2<>"Same")'
|
||||
$cf[16].Style.Font.Color.Color.Name | Should be "FFFF0000"
|
||||
$cf[14].Address.Address | Should be 'D2:D1048576'
|
||||
$cf[14].Type | Should be 'Expression'
|
||||
$cf[14].Formula | Should be 'OR(G2<>"Same",K2<>"Same")'
|
||||
$cf[14].Style.Font.Color.Color.Name | Should be "FFFF0000"
|
||||
$cf[13].Address.Address | Should be 'D2:D1048576'
|
||||
$cf[13].Type | Should be 'Expression'
|
||||
$cf[13].Formula | Should be 'OR(G2="Added",K2="Added")'
|
||||
$cf[13].Style.Fill.BackgroundColor.Color.Name | Should be 'ffffb6c1'
|
||||
$cf[14].Formula | Should be 'OR(G2="Added",K2="Added")'
|
||||
$cf[14].Style.Fill.BackgroundColor.Color.Name | Should be 'ffffb6c1'
|
||||
$cf[14].Style.Fill.PatternType.ToString() | Should be 'Solid'
|
||||
$cf[ 0].Address.Address | Should be 'F1:F1048576'
|
||||
$cf[ 0].Type | Should be 'Expression'
|
||||
$cf[ 0].Formula | Should be 'G1="Added"'
|
||||
$cf[ 0].Style.Fill.BackgroundColor.Color.Name | Should be 'ffffa500'
|
||||
$cf[ 0].Style.Fill.PatternType.ToString() | Should be 'Solid'
|
||||
}
|
||||
}
|
||||
}
|
||||
@@ -9,7 +9,7 @@ Describe ExportExcel {
|
||||
$path = "$env:TEMP\Test.xlsx"
|
||||
Remove-item -Path $path -ErrorAction SilentlyContinue
|
||||
#Test with a maximum of 100 processes for speed; export all properties, then export smaller subsets.
|
||||
$processes = Get-Process | select-object -first 100
|
||||
$processes = Get-Process | select-object -first 100 -Property * -excludeProperty Parent
|
||||
$propertyNames = $Processes[0].psobject.properties.name
|
||||
$rowcount = $Processes.Count
|
||||
$Processes | Export-Excel $path #-show
|
||||
@@ -355,13 +355,7 @@ Describe ExportExcel {
|
||||
|
||||
Context "#Example 5 # Adding a single conditional format " {
|
||||
#Test New-ConditionalText builds correctly
|
||||
$ct = New-ConditionalText -ConditionalType GreaterThan 525 -ConditionalTextColor DarkRed -BackgroundColor LightPink
|
||||
it "Created a Conditional format description " {
|
||||
$ct.BackgroundColor -is [System.Drawing.Color] | Should be $true
|
||||
$ct.ConditionalTextColor -is [System.Drawing.Color] | Should be $true
|
||||
$ct.ConditionalType -in [enum]::GetNames( [OfficeOpenXml.ConditionalFormatting.eExcelConditionalFormattingRuleType] ) |
|
||||
Should be $true
|
||||
}
|
||||
$ct = New-ConditionalText -ConditionalType GreaterThan 525 -ConditionalTextColor ([System.Drawing.Color]::DarkRed) -BackgroundColor ([System.Drawing.Color]::LightPink)
|
||||
|
||||
$path = "$env:TEMP\Test.xlsx"
|
||||
Remove-item -Path $path -ErrorAction SilentlyContinue
|
||||
@@ -398,8 +392,8 @@ Describe ExportExcel {
|
||||
#Testing -Passthrough
|
||||
$Excel = Get-Service | Select-Object Name, Status, DisplayName, ServiceName |
|
||||
Export-Excel $path -PassThru -ConditionalText $(
|
||||
New-ConditionalText Stop DarkRed LightPink
|
||||
New-ConditionalText Running Blue Cyan
|
||||
New-ConditionalText Stop ([System.Drawing.Color]::DarkRed) ([System.Drawing.Color]::LightPink)
|
||||
New-ConditionalText Running ([System.Drawing.Color]::Blue) ([System.Drawing.Color]::Cyan)
|
||||
)
|
||||
$ws = $Excel.Workbook.Worksheets[1]
|
||||
it "Added two blocks of conditional formating for the data range " {
|
||||
@@ -649,7 +643,7 @@ Describe ExportExcel {
|
||||
$warnvar = $null
|
||||
#Test create two data pages; as part of adding the second give both their own pivot table, test -autosize switch
|
||||
Get-Service | Select-Object -Property Status, Name, DisplayName, StartType, CanPauseAndContinue | Export-Excel -Path $path -AutoSize -TableName "All Services" -TableStyle Medium1 -WarningAction SilentlyContinue -WarningVariable warnvar
|
||||
Get-Process | Select-Object -Property Name, Company, Handles, CPU, VM | Export-Excel -Path $path -AutoSize -WorkSheetname 'sheet2' -TableName "Processes" -TableStyle Light1 -Title "Processes" -TitleFillPattern Solid -TitleBackgroundColor AliceBlue -TitleBold -TitleSize 22 -PivotTableDefinition $ptDef
|
||||
Get-Process | Select-Object -Property Name, Company, Handles, CPU, VM | Export-Excel -Path $path -AutoSize -WorkSheetname 'sheet2' -TableName "Processes" -TableStyle Light1 -Title "Processes" -TitleFillPattern Solid -TitleBackgroundColor ([System.Drawing.Color]::AliceBlue) -TitleBold -TitleSize 22 -PivotTableDefinition $ptDef
|
||||
$Excel = Open-ExcelPackage $path
|
||||
$ws1 = $Excel.Workbook.Worksheets["Sheet1"]
|
||||
$ws2 = $Excel.Workbook.Worksheets["Sheet2"]
|
||||
@@ -722,10 +716,10 @@ Describe ExportExcel {
|
||||
Set-ExcelRange -Address $sheet.Cells["E1:H1048576"] -HorizontalAlignment Right -NFormat "#,###"
|
||||
Set-ExcelRange -Address $sheet.Column(4) -HorizontalAlignment Right -NFormat "#,##0.0" -Bold
|
||||
Set-ExcelRange -Address $sheet.Row(1) -Bold -HorizontalAlignment Center
|
||||
Add-ConditionalFormatting -WorkSheet $sheet -Range "D2:D1048576" -DataBarColor Red
|
||||
Add-ConditionalFormatting -WorkSheet $sheet -Range "D2:D1048576" -DataBarColor ([System.Drawing.Color]::Red)
|
||||
#test Add-ConditionalFormatting -passthru and using a range (and no worksheet)
|
||||
$rule = Add-ConditionalFormatting -passthru -Address $sheet.cells["C:C"] -RuleType TopPercent -ConditionValue 20 -Bold -StrikeThru
|
||||
Add-ConditionalFormatting -WorkSheet $sheet -Range "G2:G1048576" -RuleType GreaterThan -ConditionValue "104857600" -ForeGroundColor Red -Bold -Italic -Underline -BackgroundColor Beige -BackgroundPattern LightUp -PatternColor Gray
|
||||
Add-ConditionalFormatting -WorkSheet $sheet -Range "G2:G1048576" -RuleType GreaterThan -ConditionValue "104857600" -ForeGroundColor ([System.Drawing.Color]::Red) -Bold -Italic -Underline -BackgroundColor ([System.Drawing.Color]::Beige) -BackgroundPattern LightUp -PatternColor ([System.Drawing.Color]::Gray)
|
||||
#Test Set-ExcelRange with a column
|
||||
foreach ($c in 5..9) {Set-ExcelRange $sheet.Column($c) -AutoFit }
|
||||
Add-PivotTable -PivotTableName "PT_Procs" -ExcelPackage $excel -SourceWorkSheet 1 -PivotRows Company -PivotData @{'Name' = 'Count'} -IncludePivotChart -ChartType ColumnClustered -NoLegend
|
||||
@@ -857,7 +851,7 @@ Describe ExportExcel {
|
||||
-Column 2 -ColumnOffSetPixels 35 -Width 800 -XAxisTitleText "Degrees" -XAxisTitleBold -XAxisTitleSize 12 -XMajorUnit 30 -XMinorUnit 10 -XMinValue 0 -XMaxValue 361 -XAxisNumberformat "000" `
|
||||
-YMinValue -1.25 -YMaxValue 1.25 -YMajorUnit 0.25 -YAxisNumberformat "0.00" -YAxisTitleText "Sine" -YAxisTitleBold -YAxisTitleSize 12 `
|
||||
-LegendSize 8 -legendBold -LegendPosition Bottom
|
||||
Add-ConditionalFormatting -WorkSheet $excel.Workbook.Worksheets["Sinx"] -Range "B2:B362" -RuleType LessThan -ConditionValue "=B1" -ForeGroundColor Red
|
||||
Add-ConditionalFormatting -WorkSheet $excel.Workbook.Worksheets["Sinx"] -Range "B2:B362" -RuleType LessThan -ConditionValue "=B1" -ForeGroundColor ([System.Drawing.Color]::Red)
|
||||
$ws = $Excel.Workbook.Worksheets["Sinx"]
|
||||
$d = $ws.Drawings[0]
|
||||
It "Controled the axes and title and legend of the chart " {
|
||||
@@ -916,7 +910,7 @@ Describe ExportExcel {
|
||||
Select-Object -Property Name, @{n="TotalPm";e={($_.group | Measure-Object -sum -Property pm).sum }} |
|
||||
Export-Excel -NoHeader -AutoNameRange -path $path -ReturnRange -PieChart -ShowPercent
|
||||
$Cf = New-ConditionalFormattingIconSet -Range ($range -replace "^.*:","B2:") -ConditionalFormat ThreeIconSet -Reverse -IconType Flags
|
||||
$ct = New-ConditionalText -Text "Microsoft" -ConditionalTextColor red -BackgroundColor AliceBlue -ConditionalType ContainsText
|
||||
$ct = New-ConditionalText -Text "Microsoft" -ConditionalTextColor ([System.Drawing.Color]::Red) -BackgroundColor([System.Drawing.Color]::AliceBlue) -ConditionalType ContainsText
|
||||
it "Created the Conditional formatting rules " {
|
||||
$cf.Formatter | Should be "ThreeIconSet"
|
||||
$cf.IconType | Should be "Flags"
|
||||
|
||||
@@ -10,8 +10,10 @@ Banana, London , 300, 200
|
||||
Orange, Paris, 600, 500
|
||||
Banana, Paris, 300, 200
|
||||
Apple, New York, 1200,700
|
||||
|
||||
"@ | Export-Excel -Path $path -TableStyle Medium13 -tablename "RawData" -ConditionalFormat @{Range="C2:C7"; DataBarColor="Green"} -ExcelChartDefinition @{ChartType="Doughnut";XRange="A2:B7"; YRange="C2:C7"; width=800; } -PivotTableDefinition @{Sales=@{
|
||||
PivotRows="City"; PivotColumns="Product"; PivotData=@{Gross="Sum";Net="Sum"}; PivotNumberFormat="$#,##0.00"; PivotTotals="Both"; PivotTableSyle="Medium12"; Activate=$true
|
||||
PivotRows="City"; PivotColumns="Product"; PivotData=@{Gross="Sum";Net="Sum"}; PivotNumberFormat="$#,##0.00"; PivotTotals="Both"; PivotTableStyle="Medium12"; Activate=$true
|
||||
|
||||
PivotChartDefinition=@{Title="Gross and net by city and product"; ChartType="ColumnClustered"; Column=6; Width=600; Height=360; YMajorUnit=500; YMinorUnit=100; YAxisNumberformat="$#,##0"; LegendPosition="Bottom"}}}
|
||||
|
||||
$excel = Open-ExcelPackage $path
|
||||
|
||||
@@ -1,46 +1,56 @@
|
||||
$scriptPath = Split-Path -Path $MyInvocation.MyCommand.path -Parent
|
||||
$dataPath = Join-Path -Path $scriptPath -ChildPath "First10Races.csv"
|
||||
$scriptPath = Split-Path -Path $MyInvocation.MyCommand.path -Parent
|
||||
$dataPath = Join-Path -Path $scriptPath -ChildPath "First10Races.csv"
|
||||
|
||||
Describe "Creating small named ranges with hyperlinks" {
|
||||
BeforeAll {
|
||||
$path = "$env:TEMP\Results.xlsx"
|
||||
$path = "$env:TEMP\Results.xlsx"
|
||||
Remove-Item -Path $path -ErrorAction SilentlyContinue
|
||||
#Read race results, and group by race name : export 1 row to get headers, leaving enough rows aboce to put in a link for each race
|
||||
$results = Import-Csv -Path $dataPath | Group-Object -Property RACE
|
||||
$topRow = $lastDataRow = 1 + $results.Count
|
||||
$excel = $results[0].Group[0] | Export-Excel -Path $path -StartRow $TopRow -BoldTopRow -PassThru
|
||||
$results = Import-Csv -Path $dataPath |
|
||||
Select-Object Race, @{n = "Date"; e = {[datetime]::ParseExact($_.date, "dd/MM/yyyy", (Get-Culture))}}, FinishPosition, Driver, GridPosition, Team, Points |
|
||||
Group-Object -Property RACE
|
||||
$topRow = $lastDataRow = 1 + $results.Count
|
||||
$excel = $results[0].Group[0] | Export-Excel -Path $path -StartRow $TopRow -BoldTopRow -PassThru
|
||||
|
||||
#export each group (race) below the last one, without headers, and create a range for each using the group name (Race)
|
||||
foreach ($r in $results) {
|
||||
$excel = $R.Group | Export-Excel -ExcelPackage $excel -NoHeader -StartRow ($lastDataRow +1) -RangeName $R.Name -PassThru -AutoSize
|
||||
$excel = $R.Group | Export-Excel -ExcelPackage $excel -NoHeader -StartRow ($lastDataRow + 1) -RangeName $R.Name -PassThru -AutoSize
|
||||
$lastDataRow += $R.Group.Count
|
||||
}
|
||||
$worksheet = $excel.Workbook.Worksheets[1]
|
||||
$columns = $worksheet.Dimension.Columns
|
||||
$columns = $worksheet.Dimension.Columns
|
||||
|
||||
1..$columns | ForEach-Object {Add-ExcelName -Range $worksheet.cells[$topRow,$_,$lastDataRow,$_]} #Test Add-Excel Name on its own (outside Export-Excel)
|
||||
1..$columns | ForEach-Object {Add-ExcelName -Range $worksheet.cells[$topRow, $_, $lastDataRow, $_]} #Test Add-Excel Name on its own (outside Export-Excel)
|
||||
|
||||
$scwarnVar = $null
|
||||
Set-ExcelColumn -Worksheet $worksheet -StartRow $topRow -Heading "PlacesGained/Lost" `
|
||||
-Value "=GridPosition-FinishPosition" -AutoNameRange -WarningVariable scWarnVar -WarningAction SilentlyContinue #Test as many set column options as possible.
|
||||
-Value "=GridPosition-FinishPosition" -AutoNameRange -WarningVariable scWarnVar -WarningAction SilentlyContinue #Test as many set column options as possible.
|
||||
$columns ++
|
||||
|
||||
#create a table which covers all the data. And define a pivot table which uses the same address range.
|
||||
$table = Add-ExcelTable -PassThru -Range $worksheet.cells[$topRow,1,$lastDataRow,$columns] -TableName "AllResults" -TableStyle Light4 `
|
||||
-ShowHeader -ShowFilter -ShowColumnStripes -ShowRowStripes:$false -ShowFirstColumn:$false -ShowLastColumn:$false -ShowTotal:$false #Test Add-ExcelTable outside export-Excel with as many options as possible.
|
||||
$pt = New-PivotTableDefinition -PivotTableName Analysis -SourceWorkSheet $worksheet -SourceRange $table.address.address -PivotRows Driver -PivotData @{Points="SUM"} -PivotTotals None
|
||||
$table = Add-ExcelTable -PassThru -Range $worksheet.cells[$topRow, 1, $lastDataRow, $columns] -TableName "AllResults" -TableStyle Light4 `
|
||||
-ShowHeader -ShowFilter -ShowColumnStripes -ShowRowStripes:$false -ShowFirstColumn:$false -ShowLastColumn:$false -ShowTotal:$false #Test Add-ExcelTable outside export-Excel with as many options as possible.
|
||||
$pt = New-PivotTableDefinition -PivotTableName Analysis -SourceWorkSheet $worksheet -SourceRange $table.address.address -PivotRows Driver -PivotData @{Points = "SUM"} -PivotTotals None
|
||||
|
||||
$cf = Add-ConditionalFormatting -Address $worksheet.cells[$topRow,$columns,$lastDataRow,$columns] -ThreeIconsSet Arrows -Passthru #Test using cells[r1,c1,r2,c2]
|
||||
$cf = Add-ConditionalFormatting -Address $worksheet.cells[$topRow, $columns, $lastDataRow, $columns] -ThreeIconsSet Arrows -Passthru #Test using cells[r1,c1,r2,c2]
|
||||
$cf.Icon2.Type = $cf.Icon3.Type = "Num"
|
||||
$cf.Icon2.Value = 0
|
||||
$cf.Icon3.Value = 1
|
||||
Add-ConditionalFormatting -Address $worksheet.cells["FinishPosition"] -RuleType Equal -ConditionValue 1 -ForeGroundColor Purple -Bold -Priority 1 -StopIfTrue #Test Priority and stopIfTrue and using range name
|
||||
Add-ConditionalFormatting -Address $worksheet.cells["FinishPosition"] -RuleType Equal -ConditionValue 1 -ForeGroundColor ([System.Drawing.Color]::Purple) -Bold -Priority 1 -StopIfTrue #Test Priority and stopIfTrue and using range name
|
||||
Add-ConditionalFormatting -Address $worksheet.Cells["GridPosition"] -RuleType ThreeColorScale -Reverse #Test Reverse
|
||||
$ct = New-ConditionalText -Text "Ferrari"
|
||||
$ct2 = New-ConditionalText -Range $worksheet.Names["FinishPosition"].Address -ConditionalType LessThanOrEqual -Text 3 -ConditionalText Red -Background White #Test new-conditionalText in shortest and longest forms.
|
||||
$ct2 = New-ConditionalText -Range $worksheet.Names["FinishPosition"].Address -ConditionalType LessThanOrEqual -Text 3 -ConditionalText ([System.Drawing.Color]::Red) -Background ([System.Drawing.Color]::White) #Test new-conditionalText in shortest and longest forms.
|
||||
#Create links for each group name (race) and Export them so they start at Cell A1; create a pivot table with definition just created, save the file and open in Excel
|
||||
$results | ForEach-Object {(New-Object -TypeName OfficeOpenXml.ExcelHyperLink -ArgumentList "Sheet1!$($_.Name)" , "$($_.name) GP")} | #Test Exporting Hyperlinks with display property.
|
||||
Export-Excel -ExcelPackage $excel -AutoSize -PivotTableDefinition $pt -Calculate -ConditionalFormat $ct,$ct2 #Test conditional text rules in conditional format (orignally icon sets only )
|
||||
$excel = $results | ForEach-Object {(New-Object -TypeName OfficeOpenXml.ExcelHyperLink -ArgumentList "Sheet1!$($_.Name)" , "$($_.name) GP")} | #Test Exporting Hyperlinks with display property.
|
||||
Export-Excel -ExcelPackage $excel -AutoSize -PivotTableDefinition $pt -Calculate -ConditionalFormat $ct, $ct2 -PassThru #Test conditional text rules in conditional format (orignally icon sets only )
|
||||
|
||||
$null = Add-WorkSheet -ExcelPackage $excel -WorksheetName "Points1"
|
||||
Add-PivotTable -PivotTableName "Points1" -Address $excel.Points1.Cells["A1"] -ExcelPackage $excel -SourceWorkSheet sheet1 -SourceRange $excel.Sheet1.Tables[0].Address.Address -PivotRows Driver, Date -PivotData @{Points = "SUM"} -GroupDateRow Date -GroupDatePart Years, Months
|
||||
|
||||
$null = Add-WorkSheet -ExcelPackage $excel -WorksheetName "Places1"
|
||||
$newpt = Add-PivotTable -PivotTableName "Places1" -Address $excel.Places1.Cells["A1"] -ExcelPackage $excel -SourceWorkSheet sheet1 -SourceRange $excel.Sheet1.Tables[0].Address.Address -PivotRows Driver, FinishPosition -PivotData @{Date = "Count"} -GroupNumericRow FinishPosition -GroupNumericMin 1 -GroupNumericMax 25 -GroupNumericInterval 3 -PassThru
|
||||
$newpt.RowFields[0].SubTotalFunctions = [OfficeOpenXml.Table.PivotTable.eSubTotalFunctions]::None
|
||||
Close-ExcelPackage -ExcelPackage $excel
|
||||
|
||||
$excel = Open-ExcelPackage $path
|
||||
$sheet = $excel.Workbook.Worksheets[1]
|
||||
@@ -62,14 +72,14 @@ Describe "Creating small named ranges with hyperlinks" {
|
||||
}
|
||||
Context "Adding calculated column" {
|
||||
It "Populated the cells with the right heading and formulas " {
|
||||
$sheet.Cells[( $results.Count),$columns] | Should benullorEmpty
|
||||
$sheet.Cells[(1+$results.Count),$columns].Value | Should be "PlacesGained/Lost"
|
||||
$sheet.Cells[(2+$results.Count),$columns].Formula | should be "GridPosition-FinishPosition"
|
||||
$sheet.Cells[( $results.Count), $columns] | Should benullorEmpty
|
||||
$sheet.Cells[(1 + $results.Count), $columns].Value | Should be "PlacesGained/Lost"
|
||||
$sheet.Cells[(2 + $results.Count), $columns].Formula | should be "GridPosition-FinishPosition"
|
||||
$sheet.Names["PlacesGained_Lost"] | should not benullorEmpty
|
||||
}
|
||||
It "Performed the calculation " {
|
||||
$placesMade = $Sheet.Cells[(2+$results.Count),5].value - $Sheet.Cells[(2+$results.Count),3].value
|
||||
$sheet.Cells[(2+$results.Count),$columns].value | Should be $placesmade
|
||||
$placesMade = $Sheet.Cells[(2 + $results.Count), 5].value - $Sheet.Cells[(2 + $results.Count), 3].value
|
||||
$sheet.Cells[(2 + $results.Count), $columns].value | Should be $placesmade
|
||||
}
|
||||
It "Applied ConditionalFormatting, including StopIfTrue, Priority and Reverse " {
|
||||
$sheet.ConditionalFormatting[0].Address.Start.Column | should be $columns
|
||||
@@ -98,4 +108,32 @@ Describe "Creating small named ranges with hyperlinks" {
|
||||
$sheet.Tables[0].ShowRowStripes | should not be $true
|
||||
}
|
||||
}
|
||||
Context "Adding Pivot tables" {
|
||||
it "Added a worksheet with a pivot table grouped by date " {
|
||||
$excel.Points1 | should not beNullOrEmpty
|
||||
$excel.Points1.PivotTables.Count | should be 1
|
||||
$pt = $excel.Points1.PivotTables[0]
|
||||
$pt.RowFields.Count | should be 3
|
||||
$pt.RowFields[0].name | should be "Driver"
|
||||
$pt.RowFields[0].Grouping | should benullorEmpty
|
||||
$pt.RowFields[1].name | should be "years"
|
||||
$pt.RowFields[1].Grouping | should not benullorEmpty
|
||||
$pt.RowFields[2].name | should be "date"
|
||||
$pt.RowFields[2].Grouping | should not benullorEmpty
|
||||
}
|
||||
it "Added a worksheet with a pivot table grouped by Number " {
|
||||
$excel.Places1 | should not beNullOrEmpty
|
||||
$excel.Places1.PivotTables.Count | should be 1
|
||||
$pt = $excel.Places1.PivotTables[0]
|
||||
$pt.RowFields.Count | should be 2
|
||||
$pt.RowFields[0].name | should be "Driver"
|
||||
$pt.RowFields[0].Grouping | should benullorEmpty
|
||||
$pt.RowFields[0].SubTotalFunctions.ToString() | should be "None"
|
||||
$pt.RowFields[1].name | should be "FinishPosition"
|
||||
$pt.RowFields[1].Grouping | should not benullorEmpty
|
||||
$pt.RowFields[1].Grouping.Start | should be 1
|
||||
$pt.RowFields[1].Grouping.End | should be 25
|
||||
$pt.RowFields[1].Grouping.Interval | should be 3
|
||||
}
|
||||
}
|
||||
}
|
||||
@@ -1,26 +1,28 @@
|
||||
#Requires -Modules Pester
|
||||
remove-module importExcel -erroraction silentlyContinue
|
||||
Import-Module $PSScriptRoot\..\ImportExcel.psd1 -Force
|
||||
|
||||
|
||||
Describe "Check if Function aliases exist" {
|
||||
|
||||
It "Set-Column should exist" {
|
||||
Get-Command Set-Column | Should Not Be $null
|
||||
${Alias:Set-Column} | Should Not BeNullOrEmpty
|
||||
}
|
||||
|
||||
It "Set-Row should exist" {
|
||||
Get-Command Set-Row | Should Not Be $null
|
||||
${Alias:Set-Row} | Should Not BeNullOrEmpty
|
||||
}
|
||||
|
||||
It "Set-Format should exist" {
|
||||
Get-Command Set-Format | Should Not Be $null
|
||||
${Alias:Set-Format} | Should Not BeNullOrEmpty
|
||||
}
|
||||
|
||||
It "Merge-MulipleSheets should exist" {
|
||||
<#It "Merge-MulipleSheets should exist" {
|
||||
Get-Command Merge-MulipleSheets | Should Not Be $null
|
||||
}
|
||||
|
||||
#>
|
||||
It "New-ExcelChart should exist" {
|
||||
Get-Command New-ExcelChart | Should Not Be $null
|
||||
${Alias:New-ExcelChart} | Should Not BeNullOrEmpty
|
||||
}
|
||||
|
||||
}
|
||||
@@ -22,7 +22,7 @@ ID,Product,Quantity,Price,Total
|
||||
12012,Pliers,3,14.99,44.97
|
||||
"@
|
||||
|
||||
Describe "Join Worksheet" {
|
||||
Describe "Join Worksheet part 1" {
|
||||
BeforeAll {
|
||||
$path = "$Env:TEMP\test.xlsx"
|
||||
Remove-Item -Path $path -ErrorAction SilentlyContinue
|
||||
@@ -30,7 +30,7 @@ Describe "Join Worksheet" {
|
||||
$data2 | Export-Excel -Path $path -WorkSheetname Abingdon
|
||||
$data3 | Export-Excel -Path $path -WorkSheetname Banbury
|
||||
$ptdef = New-PivotTableDefinition -PivotTableName "SummaryPivot" -PivotRows "Store" -PivotColumns "Product" -PivotData @{"Total"="SUM"} -IncludePivotChart -ChartTitle "Sales Breakdown" -ChartType ColumnStacked -ChartColumn 10
|
||||
Join-Worksheet -Path $path -WorkSheetName "Total" -Clearsheet -FromLabel "Store" -TableName "SummaryTable" -TableStyle Light1 -AutoSize -BoldTopRow -FreezePane 2,1 -Title "Store Sales Summary" -TitleBold -TitleSize 14 -TitleBackgroundColor AliceBlue -PivotTableDefinition $ptdef
|
||||
Join-Worksheet -Path $path -WorkSheetName "Total" -Clearsheet -FromLabel "Store" -TableName "SummaryTable" -TableStyle Light1 -AutoSize -BoldTopRow -FreezePane 2,1 -Title "Store Sales Summary" -TitleBold -TitleSize 14 -TitleBackgroundColor ([System.Drawing.Color]::AliceBlue) -PivotTableDefinition $ptdef
|
||||
|
||||
$excel = Export-Excel -path $path -WorkSheetname SummaryPivot -Activate -NoTotalsInPivot -PivotDataToColumn -HideSheet * -UnHideSheet "Total","SummaryPivot" -PassThru
|
||||
# Open-ExcelPackage -Path $path
|
||||
@@ -88,8 +88,11 @@ Describe "Join Worksheet" {
|
||||
$pc.Title.text | Should be "Sales Breakdown"
|
||||
}
|
||||
}
|
||||
}
|
||||
$path = "$env:TEMP\Test.xlsx"
|
||||
Remove-item -Path $path -ErrorAction SilentlyContinue
|
||||
IF ($PSVersionTable.PSVersion.Major -gt 5) {Write-warning -message "Part 2 Does not run on V6"; return}
|
||||
Describe "Join Worksheet part 2" {
|
||||
Get-WmiObject -Class win32_logicaldisk |
|
||||
Select-Object -Property DeviceId,VolumeName, Size,Freespace |
|
||||
Export-Excel -Path $path -WorkSheetname Volumes -NumberFormat "0,000"
|
||||
@@ -119,6 +122,6 @@ Describe "Join Worksheet" {
|
||||
$ws.Cells["A$NextRow"].Value | Should be $excel.Workbook.Worksheets[2].Cells["A2"].value
|
||||
$ws.Cells["B$NextRow"].Value | Should be $excel.Workbook.Worksheets[2].Cells["B2"].value
|
||||
}
|
||||
}
|
||||
}
|
||||
}
|
||||
}
|
||||
|
||||
|
||||
@@ -19,7 +19,7 @@ describe "Consistent passing of ranges." {
|
||||
$warnvar | should beNullOrEmpty
|
||||
$excel.Services.ConditionalFormatting.Count | Should be 3
|
||||
{Add-ConditionalFormatting "Status" -WorkSheet $excel.Services `
|
||||
-ForeGroundColor Green -RuleType ContainsText -ConditionValue "Running"} | Should not throw
|
||||
-ForeGroundColor ([System.Drawing.Color]::Green) -RuleType ContainsText -ConditionValue "Running"} | Should not throw
|
||||
$excel.Services.ConditionalFormatting.Count | Should be 4
|
||||
}
|
||||
Close-ExcelPackage -NoSave $excel
|
||||
@@ -32,7 +32,7 @@ describe "Consistent passing of ranges." {
|
||||
-Bold -RuleType ContainsText -ConditionValue "windows" } | Should not throw
|
||||
$excel.Services.ConditionalFormatting.Count | Should be 2
|
||||
{Add-ConditionalFormatting -WorkSheet $excel.Services -Address "a:a" `
|
||||
-RuleType ContainsText -ConditionValue "stopped" -ForeGroundColor Red } | Should not throw
|
||||
-RuleType ContainsText -ConditionValue "stopped" -ForeGroundColor ([System.Drawing.Color]::Red) } | Should not throw
|
||||
$excel.Services.ConditionalFormatting.Count | Should be 3
|
||||
}
|
||||
Close-ExcelPackage -NoSave $excel
|
||||
@@ -62,7 +62,7 @@ describe "Consistent passing of ranges." {
|
||||
$excel.Services.cells["C3"].Style.Font.UnderLine | Should be $true
|
||||
{Set-ExcelRange -WorkSheet $excel.Services -Range "Name" -Bold } | Should not throw
|
||||
$excel.Services.cells["B4"].Style.Font.Bold | Should be $true
|
||||
{$excel.Services.Column(3) | Set-ExcelRange -FontColor red } | Should not throw
|
||||
{$excel.Services.Column(3) | Set-ExcelRange -FontColor ([System.Drawing.Color]::Red) } | Should not throw
|
||||
$excel.Services.cells["C4"].Style.Font.Color.Rgb | Should be "FFFF0000"
|
||||
}
|
||||
Close-ExcelPackage -NoSave $excel
|
||||
|
||||
78
__tests__/Remove-WorkSheet.tests.ps1
Normal file
78
__tests__/Remove-WorkSheet.tests.ps1
Normal file
@@ -0,0 +1,78 @@
|
||||
#Requires -Modules Pester
|
||||
Import-Module $PSScriptRoot\..\ImportExcel.psd1 -Force
|
||||
|
||||
Describe "Remove Worksheet" {
|
||||
Context "Remove a worksheet output" {
|
||||
BeforeEach {
|
||||
# Create three sheets
|
||||
$data = ConvertFrom-Csv @"
|
||||
Name,Age
|
||||
Jane,10
|
||||
John,20
|
||||
"@
|
||||
$xlFile1 = "$env:TEMP\RemoveWorsheet1.xlsx"
|
||||
Remove-Item $xlFile1 -ErrorAction SilentlyContinue
|
||||
|
||||
$data | Export-Excel -Path $xlFile1 -WorksheetName Target1
|
||||
$data | Export-Excel -Path $xlFile1 -WorksheetName Target2
|
||||
$data | Export-Excel -Path $xlFile1 -WorksheetName Target3
|
||||
$data | Export-Excel -Path $xlFile1 -WorksheetName Sheet1
|
||||
|
||||
$xlFile2 = "$env:TEMP\RemoveWorsheet2.xlsx"
|
||||
Remove-Item $xlFile2 -ErrorAction SilentlyContinue
|
||||
|
||||
$data | Export-Excel -Path $xlFile2 -WorksheetName Target1
|
||||
$data | Export-Excel -Path $xlFile2 -WorksheetName Target2
|
||||
$data | Export-Excel -Path $xlFile2 -WorksheetName Target3
|
||||
$data | Export-Excel -Path $xlFile2 -WorksheetName Sheet1
|
||||
}
|
||||
|
||||
it "Should throw about the Path" {
|
||||
{Remove-WorkSheet} | Should throw 'Remove-WorkSheet requires the and Excel file'
|
||||
}
|
||||
|
||||
it "Should delete Target2" {
|
||||
Remove-WorkSheet -Path $xlFile1 -WorksheetName Target2
|
||||
|
||||
$actual = Get-ExcelSheetInfo -Path $xlFile1
|
||||
|
||||
$actual.Count | Should Be 3
|
||||
$actual[0].Name | Should Be "Target1"
|
||||
$actual[1].Name | Should Be "Target3"
|
||||
$actual[2].Name | Should Be "Sheet1"
|
||||
}
|
||||
|
||||
it "Should delete Sheet1" {
|
||||
Remove-WorkSheet -Path $xlFile1
|
||||
|
||||
$actual = Get-ExcelSheetInfo -Path $xlFile1
|
||||
|
||||
$actual.Count | Should Be 3
|
||||
$actual[0].Name | Should Be "Target1"
|
||||
$actual[1].Name | Should Be "Target2"
|
||||
$actual[2].Name | Should Be "Target3"
|
||||
}
|
||||
|
||||
it "Should delete multiple sheets" {
|
||||
Remove-WorkSheet -Path $xlFile1 -WorksheetName Target1, Sheet1
|
||||
|
||||
$actual = Get-ExcelSheetInfo -Path $xlFile1
|
||||
|
||||
$actual.Count | Should Be 2
|
||||
$actual[0].Name | Should Be "Target2"
|
||||
$actual[1].Name | Should Be "Target3"
|
||||
}
|
||||
|
||||
it "Should delete sheet from multiple workbooks" {
|
||||
|
||||
Get-ChildItem "$env:TEMP\RemoveWorsheet*.xlsx" | Remove-WorkSheet
|
||||
|
||||
$actual = Get-ExcelSheetInfo -Path $xlFile1
|
||||
|
||||
$actual.Count | Should Be 3
|
||||
$actual[0].Name | Should Be "Target1"
|
||||
$actual[1].Name | Should Be "Target2"
|
||||
$actual[2].Name | Should Be "Target3"
|
||||
}
|
||||
}
|
||||
}
|
||||
@@ -135,13 +135,13 @@ Describe "Set-ExcelColumn, Set-ExcelRow and Set-ExcelRange" {
|
||||
$excel = $data| Export-Excel -Path $path -AutoNameRange -PassThru
|
||||
$ws = $excel.Workbook.Worksheets["Sheet1"]
|
||||
|
||||
$c = Set-ExcelColumn -PassThru -Worksheet $ws -Heading "Total" -Value "=Quantity*Price" -NumberFormat "£#,###.00" -FontColor Blue -Bold -HorizontalAlignment Right -VerticalAlignment Top
|
||||
$c = Set-ExcelColumn -PassThru -Worksheet $ws -Heading "Total" -Value "=Quantity*Price" -NumberFormat "£#,###.00" -FontColor ([System.Drawing.Color]::Blue) -Bold -HorizontalAlignment Right -VerticalAlignment Top
|
||||
$r = Set-ExcelRow -PassThru -Worksheet $ws -StartColumn 3 -BorderAround Thin -Italic -Underline -FontSize 14 -Value {"=sum($columnName`2:$columnName$endrow)" } -VerticalAlignment Bottom
|
||||
Set-ExcelRange -Address $excel.Workbook.Worksheets["Sheet1"].cells["b3"] -HorizontalAlignment Right -VerticalAlignment Center -BorderAround Thick -BorderColor Red -StrikeThru
|
||||
Set-ExcelRange -Address $excel.Workbook.Worksheets["Sheet1"].cells["c3"] -BorderColor Red -BorderTop DashDot -BorderLeft DashDotDot -BorderBottom Dashed -BorderRight Dotted
|
||||
Set-ExcelRange -Address $excel.Workbook.Worksheets["Sheet1"].Cells["b3"] -HorizontalAlignment Right -VerticalAlignment Center -BorderAround Thick -BorderColor ([System.Drawing.Color]::Red) -StrikeThru
|
||||
Set-ExcelRange -Address $excel.Workbook.Worksheets["Sheet1"].Cells["c3"] -BorderColor ([System.Drawing.Color]::Red) -BorderTop DashDot -BorderLeft DashDotDot -BorderBottom Dashed -BorderRight Dotted
|
||||
Set-ExcelRange -WorkSheet $ws -Range "E3" -Bold:$false -FontShift Superscript -HorizontalAlignment Left
|
||||
Set-ExcelRange -WorkSheet $ws -Range "E1" -ResetFont -HorizontalAlignment General
|
||||
Set-ExcelRange -Address $ws.cells["E7"] -ResetFont -WrapText -BackgroundColor AliceBlue -BackgroundPattern DarkTrellis -PatternColor Red -NumberFormat "£#,###.00"
|
||||
Set-ExcelRange -WorkSheet $ws -Range "E1" -ResetFont -HorizontalAlignment General -FontName "Courier New" -fontSize 9
|
||||
Set-ExcelRange -Address $ws.Cells["E7"] -ResetFont -WrapText -BackgroundColor ([System.Drawing.Color]::AliceBlue) -BackgroundPattern DarkTrellis -PatternColor ([System.Drawing.Color]::Red) -NumberFormat "£#,###.00"
|
||||
Set-ExcelRange -Address $ws.Column(1) -Width 0
|
||||
Set-ExcelRange -Address $ws.Column(2) -AutoFit
|
||||
Set-ExcelRange -Address $ws.Cells["E:E"] -AutoFit
|
||||
@@ -167,50 +167,52 @@ Describe "Set-ExcelColumn, Set-ExcelRow and Set-ExcelRange" {
|
||||
$ws.Row(5).height | Should be 0
|
||||
}
|
||||
it "Set a column formula, with numberformat, color, bold face and alignment " {
|
||||
$ws.cells["e2"].Formula | Should be "Quantity*Price"
|
||||
$ws.cells["e2"].Value | Should be 147.63
|
||||
$ws.cells["e2"].Style.Font.Color.rgb | Should be "FF0000FF"
|
||||
$ws.cells["e2"].Style.Font.Bold | Should be $true
|
||||
$ws.cells["e2"].Style.Font.VerticalAlign | Should be "None"
|
||||
$ws.cells["e2"].Style.Numberformat.format | Should be "£#,###.00"
|
||||
$ws.cells["e2"].Style.HorizontalAlignment | Should be "Right"
|
||||
$ws.Cells["e2"].Formula | Should be "Quantity*Price"
|
||||
$ws.Cells["e2"].Value | Should be 147.63
|
||||
$ws.Cells["e2"].Style.Font.Color.rgb | Should be "FF0000FF"
|
||||
$ws.Cells["e2"].Style.Font.Bold | Should be $true
|
||||
$ws.Cells["e2"].Style.Font.VerticalAlign | Should be "None"
|
||||
$ws.Cells["e2"].Style.Numberformat.format | Should be "£#,###.00"
|
||||
$ws.Cells["e2"].Style.HorizontalAlignment | Should be "Right"
|
||||
}
|
||||
}
|
||||
Context "Other formatting" {
|
||||
it "Trapped an attempt to hide a range instead of a Row/Column " {
|
||||
$BadHideWarnvar | Should not beNullOrEmpty
|
||||
}
|
||||
it "Set a row formula with border font size and underline " {
|
||||
$ws.cells["b7"].style.Border.Top.Style | Should be "None"
|
||||
$ws.cells["F7"].style.Border.Top.Style | Should be "None"
|
||||
$ws.cells["C7"].style.Border.Top.Style | Should be "Thin"
|
||||
$ws.cells["C7"].style.Border.Bottom.Style | Should be "Thin"
|
||||
$ws.cells["C7"].style.Border.Right.Style | Should be "None"
|
||||
$ws.cells["C7"].style.Border.Left.Style | Should be "Thin"
|
||||
$ws.cells["E7"].style.Border.Left.Style | Should be "None"
|
||||
$ws.cells["E7"].style.Border.Right.Style | Should be "Thin"
|
||||
$ws.cells["C7"].style.Font.size | Should be 14
|
||||
$ws.cells["C7"].Formula | Should be "sum(C2:C6)"
|
||||
$ws.cells["C7"].value | Should be 81
|
||||
$ws.cells["C7"].style.Font.UnderLine | Should be $true
|
||||
$ws.cells["C6"].style.Font.UnderLine | Should be $false
|
||||
it "Set and calculated a row formula with border font size and underline " {
|
||||
$ws.Cells["b7"].Style.Border.Top.Style | Should be "None"
|
||||
$ws.Cells["F7"].Style.Border.Top.Style | Should be "None"
|
||||
$ws.Cells["C7"].Style.Border.Top.Style | Should be "Thin"
|
||||
$ws.Cells["C7"].Style.Border.Bottom.Style | Should be "Thin"
|
||||
$ws.Cells["C7"].Style.Border.Right.Style | Should be "None"
|
||||
$ws.Cells["C7"].Style.Border.Left.Style | Should be "Thin"
|
||||
$ws.Cells["E7"].Style.Border.Left.Style | Should be "None"
|
||||
$ws.Cells["E7"].Style.Border.Right.Style | Should be "Thin"
|
||||
$ws.Cells["C7"].Style.Font.size | Should be 14
|
||||
$ws.Cells["C7"].Formula | Should be "sum(C2:C6)"
|
||||
$ws.Cells["C7"].value | Should be 81
|
||||
$ws.Cells["C7"].Style.Font.UnderLine | Should be $true
|
||||
$ws.Cells["C6"].Style.Font.UnderLine | Should be $false
|
||||
}
|
||||
it "Set custom text wrapping, alignment, superscript, border and Fill " {
|
||||
$ws.cells["e3"].Style.HorizontalAlignment | Should be "Left"
|
||||
$ws.cells["e3"].Style.Font.VerticalAlign | Should be "Superscript"
|
||||
$ws.cells["b3"].style.Border.Left.Color.Rgb | Should be "FFFF0000"
|
||||
$ws.cells["b3"].style.Border.Left.Style | Should be "Thick"
|
||||
$ws.cells["b3"].style.Border.Right.Style | Should be "Thick"
|
||||
$ws.cells["b3"].style.Border.Top.Style | Should be "Thick"
|
||||
$ws.cells["b3"].style.Border.Bottom.Style | Should be "Thick"
|
||||
$ws.cells["b3"].style.Font.Strike | Should be $true
|
||||
$ws.cells["e1"].Style.Font.Color.rgb | Should be "ff000000"
|
||||
$ws.cells["e1"].Style.Font.Bold | Should be $false
|
||||
$ws.cells["C6"].style.WrapText | Should be $false
|
||||
$ws.cells["e7"].style.WrapText | Should be $true
|
||||
$ws.cells["e7"].Style.Fill.BackgroundColor.Rgb | Should be "FFF0F8FF"
|
||||
$ws.cells["e7"].Style.Fill.PatternColor.Rgb | Should be "FFFF0000"
|
||||
$ws.cells["e7"].Style.Fill.PatternType | Should be "DarkTrellis"
|
||||
it "Set custom font, size, text-wrapping, alignment, superscript, border and Fill " {
|
||||
$ws.Cells["b3"].Style.Border.Left.Color.Rgb | Should be "FFFF0000"
|
||||
$ws.Cells["b3"].Style.Border.Left.Style | Should be "Thick"
|
||||
$ws.Cells["b3"].Style.Border.Right.Style | Should be "Thick"
|
||||
$ws.Cells["b3"].Style.Border.Top.Style | Should be "Thick"
|
||||
$ws.Cells["b3"].Style.Border.Bottom.Style | Should be "Thick"
|
||||
$ws.Cells["b3"].Style.Font.Strike | Should be $true
|
||||
$ws.Cells["e1"].Style.Font.Color.Rgb | Should be "ff000000"
|
||||
$ws.Cells["e1"].Style.Font.Bold | Should be $false
|
||||
$ws.Cells["e1"].Style.Font.Name | Should be "Courier New"
|
||||
$ws.Cells["e1"].Style.Font.Size | Should be 9
|
||||
$ws.Cells["e3"].Style.Font.VerticalAlign | Should be "Superscript"
|
||||
$ws.Cells["e3"].Style.HorizontalAlignment | Should be "Left"
|
||||
$ws.Cells["C6"].Style.WrapText | Should be $false
|
||||
$ws.Cells["e7"].Style.WrapText | Should be $true
|
||||
$ws.Cells["e7"].Style.Fill.BackgroundColor.Rgb | Should be "FFF0F8FF"
|
||||
$ws.Cells["e7"].Style.Fill.PatternColor.Rgb | Should be "FFFF0000"
|
||||
$ws.Cells["e7"].Style.Fill.PatternType | Should be "DarkTrellis"
|
||||
}
|
||||
}
|
||||
|
||||
@@ -233,9 +235,9 @@ Describe "Set-ExcelColumn, Set-ExcelRow and Set-ExcelRange" {
|
||||
$excel = $DriverData | Export-Excel -PassThru -Path $path -AutoSize -AutoNameRange
|
||||
$ws = $excel.Workbook.Worksheets[1]
|
||||
|
||||
Set-ExcelColumn -Worksheet $ws -Heading "Link" -AutoSize -Value {"https://en.wikipedia.org" + $worksheet.cells["B$Row"].value }
|
||||
Set-ExcelColumn -Worksheet $ws -Heading "Link" -AutoSize -Value {"https://en.wikipedia.org" + $worksheet.Cells["B$Row"].value }
|
||||
$c = Set-ExcelColumn -PassThru -Worksheet $ws -Heading "NextBirthday" -Value {
|
||||
$bmonth = $worksheet.cells["C$Row"].value.month ; $bDay = $worksheet.cells["C$Row"].value.day
|
||||
$bmonth = $worksheet.Cells["C$Row"].value.month ; $bDay = $worksheet.Cells["C$Row"].value.day
|
||||
$cMonth = [datetime]::Now.Month ; $cday = [datetime]::Now.day ; $cyear = [datetime]::Now.Year
|
||||
if (($cmonth -gt $bmonth) -or (($cMonth -eq $bmonth) -and ($cday -ge $bDay))){
|
||||
[datetime]::new($cyear+1, $bmonth, $bDay)
|
||||
@@ -322,11 +324,11 @@ Describe "Table Formatting" {
|
||||
$excel = $data2 | Export-excel -path $path -WorksheetName Hardware -AutoNameRange -AutoSize -BoldTopRow -FreezeTopRow -PassThru
|
||||
$ws = $excel.Workbook.Worksheets[1]
|
||||
#test showfilter & TotalSettings
|
||||
$Table = Add-ExcelTable -PassThru -Range $ws.cells[$($ws.Dimension.address)] -TableStyle Light1 -TableName HardwareTable -TotalSettings @{"Total"="Sum"} -ShowFirstColumn -ShowFilter:$false
|
||||
$Table = Add-ExcelTable -PassThru -Range $ws.Cells[$($ws.Dimension.address)] -TableStyle Light1 -TableName HardwareTable -TotalSettings @{"Total"="Sum"} -ShowFirstColumn -ShowFilter:$false
|
||||
#test expnading named number formats
|
||||
Set-ExcelColumn -Worksheet $ws -Column 4 -NumberFormat 'Currency'
|
||||
Set-ExcelColumn -Worksheet $ws -Column 5 -NumberFormat 'Currency'
|
||||
$PtDef =New-PivotTableDefinition -PivotTableName Totals -PivotRows Product -PivotData @{"Total"="Sum"} -PivotNumberFormat Currency -PivotTotals None -PivotTableSyle Dark2
|
||||
$PtDef =New-PivotTableDefinition -PivotTableName Totals -PivotRows Product -PivotData @{"Total"="Sum"} -PivotNumberFormat Currency -PivotTotals None -PivotTableStyle Dark2
|
||||
Export-excel -ExcelPackage $excel -WorksheetName Hardware -PivotTableDefinition $PtDef
|
||||
$excel= Open-ExcelPackage -Path $path
|
||||
$ws1 = $excel.Workbook.Worksheets["Hardware"]
|
||||
|
||||
BIN
appveyor.yml
BIN
appveyor.yml
Binary file not shown.
15
azure-pipelines.yml
Normal file
15
azure-pipelines.yml
Normal file
@@ -0,0 +1,15 @@
|
||||
resources:
|
||||
- repo: self
|
||||
queue:
|
||||
name: Hosted VS2017
|
||||
steps:
|
||||
- powershell: ./ '.\DoTests.ps1'
|
||||
displayName: 'PowerShell Script'
|
||||
|
||||
- task: ArchiveFiles@2
|
||||
displayName: 'Archive $(Build.BinariesDirectory)'
|
||||
|
||||
trigger:
|
||||
paths:
|
||||
exclude:
|
||||
- README.md
|
||||
@@ -3,29 +3,37 @@
|
||||
.Synopsis
|
||||
Compares two worksheets and shows the differences.
|
||||
.Description
|
||||
This command takes two file names, one or two worksheet name and a name for a key column.
|
||||
It reads the worksheet from each file and decides the column names.
|
||||
It builds a hashtable of the key-column values and the rows in which they appear.
|
||||
It then uses PowerShell's compare object command to compare the sheets (explicity checking
|
||||
all the column names which have not been excluded). For the difference rows it adds the
|
||||
row number for the key of that row - we have to add the key after doing the comparison,
|
||||
otherwise identical rows at diffeent positions in the file will not will be considered to match.
|
||||
This command takes two file names, one or two worksheet names and a name
|
||||
for a "key" column. It reads the worksheet from each file and decides the
|
||||
column names and builds a hashtable of the key-column values and the
|
||||
rows in which they appear.
|
||||
It then uses PowerShell's Compare-Object command to compare the sheets
|
||||
(explicitly checkingall the column names which have not been excluded).
|
||||
For the difference rows it adds the row number for the key of that row -
|
||||
we have to add the key after doing the comparison, otherwise identical
|
||||
rows at different positions in the file will not be considered a match.
|
||||
We also add the name of the file and sheet in which the difference occurs.
|
||||
If -BackgroundColor is specified the difference rows will be changed to that background in the orginal file.
|
||||
If -BackgroundColor is specified the difference rows will be changed to
|
||||
that background in the orginal file.
|
||||
.Example
|
||||
Compare-WorkSheet -Referencefile 'Server56.xlsx' -Differencefile 'Server57.xlsx' -WorkSheetName Products -key IdentifyingNumber -ExcludeProperty Install* | Format-Table
|
||||
|
||||
The two workbooks in this example contain the result of redirecting a subset of properties from Get-WmiObject -Class win32_product to Export-Excel.
|
||||
The command compares the "Products" pages in the two workbooks, but we don't want to register a difference if the software was installed on a
|
||||
different date or from a different place, and excluding Install* removes InstallDate and InstallSource.
|
||||
This data doesn't have a "Name" column" so we specify the "IdentifyingNumber" column as the key.
|
||||
The two workbooks in this example contain the result of redirecting a subset
|
||||
of properties from Get-WmiObject -Class win32_product to Export-Excel.
|
||||
The command compares the "Products" pages in the two workbooks, but we
|
||||
don't want to register a difference if the software was installed on a
|
||||
different date or from a different place, and excluding Install* removes
|
||||
InstallDate and InstallSource. This data doesn't have a "Name" column, so
|
||||
we specify the "IdentifyingNumber" column as the key.
|
||||
The results will be presented as a table.
|
||||
.Example
|
||||
compare-WorkSheet "Server54.xlsx" "Server55.xlsx" -WorkSheetName Services -GridView
|
||||
Compare-WorkSheet "Server54.xlsx" "Server55.xlsx" -WorkSheetName Services -GridView
|
||||
|
||||
This time two workbooks contain the result of redirecting Get-WmiObject -Class win32_service to Export-Excel.
|
||||
Here the -Differencefile and -Referencefile parameter switches are assumed , and the default setting for -key ("Name") works for services
|
||||
This will display the differences between the "Services" sheets using a grid view
|
||||
This time two workbooks contain the result of redirecting the command
|
||||
Get-WmiObject -Class win32_service to Export-Excel. Here the -Differencefile
|
||||
and -Referencefile parameter switches are assumed and the default setting for
|
||||
-Key ("Name") works for services. This will display the differences between
|
||||
the "Services" sheets using a grid view
|
||||
.Example
|
||||
Compare-WorkSheet 'Server54.xlsx' 'Server55.xlsx' -WorkSheetName Services -BackgroundColor lightGreen
|
||||
|
||||
@@ -33,25 +41,32 @@
|
||||
.Example
|
||||
Compare-WorkSheet 'Server54.xlsx' 'Server55.xlsx' -WorkSheetName Services -BackgroundColor lightGreen -FontColor Red -Show
|
||||
|
||||
This example builds on the previous one: this time where two changed rows have the value in the "Name" column (the default value for -Key),
|
||||
this version adds highlighting of the changed cells in red; and then opens the Excel file.
|
||||
This example builds on the previous one: this time where two changed rows have
|
||||
the value in the "Name" column (the default value for -Key), this version adds
|
||||
highlighting of the changed cells in red; and then opens the Excel file.
|
||||
.Example
|
||||
Compare-WorkSheet 'Pester-tests.xlsx' 'Pester-tests.xlsx' -WorkSheetName 'Server1','Server2' -Property "full Description","Executed","Result" -Key "full Description"
|
||||
|
||||
This time the reference file and the difference file are the same file and two different sheets are used. Because the tests include the
|
||||
machine name and time the test was run the command specifies that a limited set of columns should be used.
|
||||
This time the reference file and the difference file are the same file and
|
||||
two different sheets are used. Because the tests include the machine name
|
||||
and time the test was run, the command specifies that a limited set of
|
||||
columns should be used.
|
||||
.Example
|
||||
Compare-WorkSheet 'Server54.xlsx' 'Server55.xlsx' -WorkSheetName general -Startrow 2 -Headername Label,value -Key Label -GridView -ExcludeDifferent
|
||||
|
||||
The "General" page in the two workbooks has a title and two unlabelled columns with a row each for CPU, Memory, Domain, Disk and so on;
|
||||
so the command is instructed to start at row 2 in order to skip the title and given names for the columns: the first is "label" and the Second "Value";
|
||||
the label acts as the key. This time we interested the rows which are the same in both sheets,
|
||||
and the result is displayed using grid view. Note that grid view works best when the number of columns is small.
|
||||
The "General" page in the two workbooks has a title and two unlabelled columns
|
||||
with a row each for CPU, Memory, Domain, Disk and so on. So the command is
|
||||
told to start at row 2 in order to skip the title and given names for the
|
||||
columns: the first is "label" and the second "Value"; the label acts as the key.
|
||||
This time we are interested in those rows which are the same in both sheets,
|
||||
and the result is displayed using grid view.
|
||||
Note that grid view works best when the number of columns is small.
|
||||
.Example
|
||||
Compare-WorkSheet 'Server1.xlsx' 'Server2.xlsx' -WorkSheetName general -Startrow 2 -Headername Label,value -Key Label -BackgroundColor White -Show -AllDataBackgroundColor LightGray
|
||||
|
||||
This version of the previous command highlights all the cells in lightgray and then sets the changed rows back to white;
|
||||
only the unchanged rows are highlighted
|
||||
This version of the previous command highlights all the cells in LightGray
|
||||
and then sets the changed rows back to white.
|
||||
Only the unchanged rows are highlighted.
|
||||
#>
|
||||
[cmdletbinding(DefaultParameterSetName)]
|
||||
Param(
|
||||
@@ -63,9 +78,9 @@
|
||||
$Differencefile ,
|
||||
#Name(s) of worksheets to compare.
|
||||
$WorkSheetName = "Sheet1",
|
||||
#Properties to include in the DIFF - supports wildcards, default is "*".
|
||||
#Properties to include in the comparison - supports wildcards, default is "*".
|
||||
$Property = "*" ,
|
||||
#Properties to exclude from the search - supports wildcards.
|
||||
#Properties to exclude from the comparison - supports wildcards.
|
||||
$ExcludeProperty ,
|
||||
#Specifies custom property names to use, instead of the values defined in the starting row of the sheet.
|
||||
[Parameter(ParameterSetName='B', Mandatory)]
|
||||
@@ -75,25 +90,25 @@
|
||||
[switch]$NoHeader,
|
||||
#The row from where we start to import data: all rows above the start row are disregarded. By default, this is the first row.
|
||||
[int]$Startrow = 1,
|
||||
#If specified, highlights all the cells - so you can make Equal cells one colour, and Diff cells another.
|
||||
[System.Drawing.Color]$AllDataBackgroundColor,
|
||||
#If specified, highlights the DIFF rows.
|
||||
[System.Drawing.Color]$BackgroundColor,
|
||||
#If specified identifies the tabs which contain DIFF rows (ignored if -BackgroundColor is omitted).
|
||||
[System.Drawing.Color]$TabColor,
|
||||
#If specified, highlights all the cells - so you can make Equal cells one color, and Different cells another.
|
||||
$AllDataBackgroundColor,
|
||||
#If specified, highlights the rows with differences.
|
||||
$BackgroundColor,
|
||||
#If specified identifies the tabs which contain difference rows (ignored if -BackgroundColor is omitted).
|
||||
$TabColor,
|
||||
#Name of a column which is unique and will be used to add a row to the DIFF object, defaults to "Name".
|
||||
$Key = "Name" ,
|
||||
#If specified, highlights the DIFF columns in rows which have the same key.
|
||||
[System.Drawing.Color]$FontColor,
|
||||
#If specified opens the Excel workbooks instead of outputting the diff to the console (unless -Passthru is also specified).
|
||||
$FontColor,
|
||||
#If specified, opens the Excel workbooks instead of outputting the diff to the console (unless -PassThru is also specified).
|
||||
[Switch]$Show,
|
||||
#If specified, the command tries to the show the DIFF in a Grid-View and not on the console. (unless-Passthru is also specified). This Works best with few columns selected, and requires a key.
|
||||
#If specified, the command tries to the show the DIFF in a Grid-View and not on the console. (unless-PassThru is also specified). This works best with few columns selected, and requires a key.
|
||||
[switch]$GridView,
|
||||
#If specified -Passthrough a full set of diff data is returned without filtering to the specified properties.
|
||||
#If specifieda full set of DIFF data is returned without filtering to the specified properties.
|
||||
[Switch]$PassThru,
|
||||
#If specified the result will include Equal rows as well. By default only Different rows are returned.
|
||||
#If specified the result will include equal rows as well. By default only different rows are returned.
|
||||
[Switch]$IncludeEqual,
|
||||
#If Specified the result includes only the rows where both are equal.
|
||||
#If specified, the result includes only the rows where both are equal.
|
||||
[Switch]$ExcludeDifferent
|
||||
)
|
||||
|
||||
@@ -153,7 +168,7 @@
|
||||
foreach ($file in $updates) {
|
||||
try {$xl = Open-ExcelPackage -Path $file.name }
|
||||
catch {Write-warning -Message "Can't open $($file.Name) for writing." ; return}
|
||||
if ($AllDataBackgroundColor) {
|
||||
if ($PSBoundParameters.ContainsKey("AllDataBackgroundColor")) {
|
||||
$file.Group._sheet | Sort-Object -Unique | ForEach-Object {
|
||||
$ws = $xl.Workbook.Worksheets[$_]
|
||||
if ($headerName) {$range = "A" + $startrow + ":" + $ws.dimension.end.address}
|
||||
@@ -166,7 +181,8 @@
|
||||
$range = $ws.Dimension -replace "\d+",$row._row
|
||||
Set-Format -WorkSheet $ws -Range $range -BackgroundColor $BackgroundColor
|
||||
}
|
||||
if ($TabColor) {
|
||||
if ($PSBoundParameters.ContainsKey("TabColor")) {
|
||||
if ($TabColor -is [string]) {$TabColor = [System.Drawing.Color]::$TabColor }
|
||||
foreach ($tab in ($file.group._sheet | Select-Object -Unique)) {
|
||||
$xl.Workbook.Worksheets[$tab].TabColor = $TabColor
|
||||
}
|
||||
@@ -174,7 +190,7 @@
|
||||
$xl.save() ; $xl.Stream.Close() ; $xl.Dispose()
|
||||
}
|
||||
}
|
||||
#if font colour was specified, set it on changed properties where the same key appears in both sheets.
|
||||
#if font color was specified, set it on changed properties where the same key appears in both sheets.
|
||||
if ($diff -and $FontColor -and ($propList -contains $Key) ) {
|
||||
$updates = $diff.where({$_.SideIndicator -ne "=="}) | Group-object -Property $Key | Where-Object {$_.count -eq 2}
|
||||
if ($updates) {
|
||||
|
||||
BIN
images/GroupingNumeric.png
Normal file
BIN
images/GroupingNumeric.png
Normal file
Binary file not shown.
|
After Width: | Height: | Size: 200 KiB |
BIN
images/exportstockinfo.gif
Normal file
BIN
images/exportstockinfo.gif
Normal file
Binary file not shown.
|
After Width: | Height: | Size: 3.2 MiB |
Reference in New Issue
Block a user