mirror of
https://github.com/dfinke/ImportExcel.git
synced 2025-12-15 15:53:32 +00:00
Compare commits
52 Commits
| Author | SHA1 | Date | |
|---|---|---|---|
|
|
d1f41012a1 | ||
|
|
0fbe9dbc9b | ||
|
|
e0b2d15c53 | ||
|
|
34c924ae19 | ||
|
|
9217962306 | ||
|
|
56acf56430 | ||
|
|
ef9be471ab | ||
|
|
9db2bc068e | ||
|
|
9560ea83f9 | ||
|
|
9c79ba573c | ||
|
|
894e645a47 | ||
|
|
f3dc390bfa | ||
|
|
f0f58f84a0 | ||
|
|
7ded24d2f9 | ||
|
|
cf964e3e4f | ||
|
|
8c5b3b2f5f | ||
|
|
8409adeeba | ||
|
|
153d4d8c45 | ||
|
|
69f9ba7d17 | ||
|
|
e4deb5801e | ||
|
|
1a74c0f0d0 | ||
|
|
72e44da219 | ||
|
|
bef2f29651 | ||
|
|
787dda70ee | ||
|
|
285e9e4949 | ||
|
|
01e3ea206d | ||
|
|
6f3420d11e | ||
|
|
2981bf23b1 | ||
|
|
c5cc018eb5 | ||
|
|
268d48ce3d | ||
|
|
eca631670c | ||
|
|
284560e109 | ||
|
|
234615dfdb | ||
|
|
d31cd04781 | ||
|
|
77481f2901 | ||
|
|
54fec69f88 | ||
|
|
1dc9a02d7d | ||
|
|
f86fdbab22 | ||
|
|
66937db040 | ||
|
|
80520299aa | ||
|
|
2753a6876a | ||
|
|
ade442b18c | ||
|
|
45ba112f73 | ||
|
|
e1fe36699b | ||
|
|
b3f4b188da | ||
|
|
0ce75794e6 | ||
|
|
3afe2059e5 | ||
|
|
66b7b64779 | ||
|
|
d90cd6d2d0 | ||
|
|
1d1f266fb6 | ||
|
|
4945b4d6e3 | ||
|
|
21b5a11aca |
@@ -51,7 +51,7 @@ Set-Format -Address $sheet1.Cells["E2:G2"] -BorderBottom $BorderBottom -BorderCo
|
||||
Set-Format -Address $sheet1.Cells["I2:K2"] -BorderBottom $BorderBottom -BorderColor $BorderColor
|
||||
Set-Format -Address $sheet1.Cells["M2:O2"] -BorderBottom $BorderBottom -BorderColor $BorderColor
|
||||
|
||||
Set-Format -Address $sheet1.Cells["A2:C8"] -FontColor GrayText
|
||||
Set-Format -Address $sheet1.Cells["A2:C8"] -FontColor Gray
|
||||
|
||||
$HorizontalAlignment = "Center"
|
||||
Set-Format -Address $sheet1.Cells["F1"] -HorizontalAlignment $HorizontalAlignment -Bold -Value Revenue
|
||||
|
||||
24
Examples/FormatCellStyles/ApplyStyle.ps1
Normal file
24
Examples/FormatCellStyles/ApplyStyle.ps1
Normal file
@@ -0,0 +1,24 @@
|
||||
$data = ConvertFrom-Csv @'
|
||||
Item,Quantity,Price,Total Cost
|
||||
Footballs,9,21.95,197.55
|
||||
Cones,36,7.99,287.64
|
||||
Shin Guards,14,10.95,153.3
|
||||
Turf Shoes,22,79.95,1758.9
|
||||
Baseballs,68,7.99,543.32
|
||||
Baseball Gloves,31,65.00,2015.00
|
||||
Baseball Bats,38,159.00,6042.00
|
||||
'@
|
||||
|
||||
$f = "$env:TEMP\styles.xlsx"
|
||||
Remove-Item $f -ErrorAction SilentlyContinue
|
||||
|
||||
$pkg = $data | Export-Excel -Path $f -AutoSize -PassThru
|
||||
|
||||
$ws = $pkg.Workbook.Worksheets["Sheet1"]
|
||||
|
||||
Set-ExcelRange -WorkSheet $ws -Range "A2:C6" -BackgroundColor PeachPuff -FontColor Purple -FontSize 12 -Width 12
|
||||
Set-ExcelRange -WorkSheet $ws -Range "D2:D6" -BackgroundColor WhiteSmoke -FontColor Orange -Bold -FontSize 12 -Width 12
|
||||
Set-ExcelRange -WorkSheet $ws -Range "A1:D1" -BackgroundColor BlueViolet -FontColor Wheat -FontSize 12 -Width 12
|
||||
Set-ExcelRange -WorkSheet $ws -Range "A:A" -Width 15
|
||||
|
||||
Close-ExcelPackage -ExcelPackage $pkg -Show
|
||||
101
Examples/Grouping/First10Races.csv
Normal file
101
Examples/Grouping/First10Races.csv
Normal file
@@ -0,0 +1,101 @@
|
||||
Race,Date,FinishPosition,Driver,GridPosition,Team,Points
|
||||
Australian,25/03/2018,1,Sebastian Vettel,3,Ferrari,25
|
||||
Australian,25/03/2018,2,Lewis Hamilton,1,Mercedes,18
|
||||
Australian,25/03/2018,3,Kimi Räikkönen,2,Ferrari,15
|
||||
Australian,25/03/2018,4,Daniel Ricciardo,8,Red Bull Racing-TAG Heuer,12
|
||||
Australian,25/03/2018,5,Fernando Alonso,10,McLaren-Renault,10
|
||||
Australian,25/03/2018,6,Max Verstappen,4,Red Bull Racing-TAG Heuer,8
|
||||
Australian,25/03/2018,7,Nico Hülkenberg,7,Renault,6
|
||||
Australian,25/03/2018,8,Valtteri Bottas,15,Mercedes,4
|
||||
Australian,25/03/2018,9,Stoffel Vandoorne,11,McLaren-Renault,2
|
||||
Australian,25/03/2018,10,Carlos Sainz,9,Renault,1
|
||||
Bahrain,08/04/2018,1,Sebastian Vettel,1,Ferrari,25
|
||||
Bahrain,08/04/2018,2,Valtteri Bottas,3,Mercedes,18
|
||||
Bahrain,08/04/2018,3,Lewis Hamilton,9,Mercedes,15
|
||||
Bahrain,08/04/2018,4,Pierre Gasly,5,STR-Honda,12
|
||||
Bahrain,08/04/2018,5,Kevin Magnussen,6,Haas-Ferrari,10
|
||||
Bahrain,08/04/2018,6,Nico Hülkenberg,7,Renault,8
|
||||
Bahrain,08/04/2018,7,Fernando Alonso,13,McLaren-Renault,6
|
||||
Bahrain,08/04/2018,8,Stoffel Vandoorne,14,McLaren-Renault,4
|
||||
Bahrain,08/04/2018,9,Marcus Ericsson,17,Sauber-Ferrari,2
|
||||
Bahrain,08/04/2018,10,Esteban Ocon,8,Force India-Mercedes,1
|
||||
Chinese,15/04/2018,1,Daniel Ricciardo,6,Red Bull Racing-TAG Heuer,25
|
||||
Chinese,15/04/2018,2,Valtteri Bottas,3,Mercedes,18
|
||||
Chinese,15/04/2018,3,Kimi Räikkönen,2,Ferrari,15
|
||||
Chinese,15/04/2018,4,Lewis Hamilton,4,Mercedes,12
|
||||
Chinese,15/04/2018,5,Max Verstappen,5,Red Bull Racing-TAG Heuer,10
|
||||
Chinese,15/04/2018,6,Nico Hülkenberg,7,Renault,8
|
||||
Chinese,15/04/2018,7,Fernando Alonso,13,McLaren-Renault,6
|
||||
Chinese,15/04/2018,8,Sebastian Vettel,1,Ferrari,4
|
||||
Chinese,15/04/2018,9,Carlos Sainz,9,Renault,2
|
||||
Chinese,15/04/2018,10,Kevin Magnussen,11,Haas-Ferrari,1
|
||||
Azerbaijan,29/04/2018,1,Lewis Hamilton,2,Mercedes,25
|
||||
Azerbaijan,29/04/2018,2,Kimi Räikkönen,6,Ferrari,18
|
||||
Azerbaijan,29/04/2018,3,Sergio Pérez,8,Force India-Mercedes,15
|
||||
Azerbaijan,29/04/2018,4,Sebastian Vettel,1,Ferrari,12
|
||||
Azerbaijan,29/04/2018,5,Carlos Sainz,9,Renault,10
|
||||
Azerbaijan,29/04/2018,6,Charles Leclerc,13,Sauber-Ferrari,8
|
||||
Azerbaijan,29/04/2018,7,Fernando Alonso,12,McLaren-Renault,6
|
||||
Azerbaijan,29/04/2018,8,Lance Stroll,10,Williams-Mercedes,4
|
||||
Azerbaijan,29/04/2018,9,Stoffel Vandoorne,16,McLaren-Renault,2
|
||||
Azerbaijan,29/04/2018,10,Brendon Hartley,19,STR-Honda,1
|
||||
Spanish,13/05/2018,1,Lewis Hamilton,1,Mercedes,25
|
||||
Spanish,13/05/2018,2,Valtteri Bottas,2,Mercedes,18
|
||||
Spanish,13/05/2018,3,Max Verstappen,5,Red Bull Racing-TAG Heuer,15
|
||||
Spanish,13/05/2018,4,Sebastian Vettel,3,Ferrari,12
|
||||
Spanish,13/05/2018,5,Daniel Ricciardo,6,Red Bull Racing-TAG Heuer,10
|
||||
Spanish,13/05/2018,6,Kevin Magnussen,7,Haas-Ferrari,8
|
||||
Spanish,13/05/2018,7,Carlos Sainz,9,Renault,6
|
||||
Spanish,13/05/2018,8,Fernando Alonso,8,McLaren-Renault,4
|
||||
Spanish,13/05/2018,9,Sergio Pérez,15,Force India-Mercedes,2
|
||||
Spanish,13/05/2018,10,Charles Leclerc,14,Sauber-Ferrari,1
|
||||
Monaco,27/05/2018,1,Daniel Ricciardo,1,Red Bull Racing-TAG Heuer,25
|
||||
Monaco,27/05/2018,2,Sebastian Vettel,2,Ferrari,18
|
||||
Monaco,27/05/2018,3,Lewis Hamilton,3,Mercedes,15
|
||||
Monaco,27/05/2018,4,Kimi Räikkönen,4,Ferrari,12
|
||||
Monaco,27/05/2018,5,Valtteri Bottas,5,Mercedes,10
|
||||
Monaco,27/05/2018,6,Esteban Ocon,6,Force India-Mercedes,8
|
||||
Monaco,27/05/2018,7,Pierre Gasly,10,STR-Honda,6
|
||||
Monaco,27/05/2018,8,Nico Hülkenberg,11,Renault,4
|
||||
Monaco,27/05/2018,9,Max Verstappen,20,Red Bull Racing-TAG Heuer,2
|
||||
Monaco,27/05/2018,10,Carlos Sainz,8,Renault,1
|
||||
Canadian,10/06/2018,1,Sebastian Vettel,1,Ferrari,25
|
||||
Canadian,10/06/2018,2,Valtteri Bottas,2,Mercedes,18
|
||||
Canadian,10/06/2018,3,Max Verstappen,3,Red Bull Racing-TAG Heuer,15
|
||||
Canadian,10/06/2018,4,Daniel Ricciardo,6,Red Bull Racing-TAG Heuer,12
|
||||
Canadian,10/06/2018,5,Lewis Hamilton,4,Mercedes,10
|
||||
Canadian,10/06/2018,6,Kimi Räikkönen,5,Ferrari,8
|
||||
Canadian,10/06/2018,7,Nico Hülkenberg,7,Renault,6
|
||||
Canadian,10/06/2018,8,Carlos Sainz,9,Renault,4
|
||||
Canadian,10/06/2018,9,Esteban Ocon,8,Force India-Mercedes,2
|
||||
Canadian,10/06/2018,10,Charles Leclerc,13,Sauber-Ferrari,1
|
||||
French,24/06/2018,1,Lewis Hamilton,1,Mercedes,25
|
||||
French,24/06/2018,2,Max Verstappen,4,Red Bull Racing-TAG Heuer,18
|
||||
French,24/06/2018,3,Kimi Räikkönen,6,Ferrari,15
|
||||
French,24/06/2018,4,Daniel Ricciardo,5,Red Bull Racing-TAG Heuer,12
|
||||
French,24/06/2018,5,Sebastian Vettel,3,Ferrari,10
|
||||
French,24/06/2018,6,Kevin Magnussen,9,Haas-Ferrari,8
|
||||
French,24/06/2018,7,Valtteri Bottas,2,Mercedes,6
|
||||
French,24/06/2018,8,Carlos Sainz,7,Renault,4
|
||||
French,24/06/2018,9,Nico Hülkenberg,12,Renault,2
|
||||
French,24/06/2018,10,Charles Leclerc,8,Sauber-Ferrari,1
|
||||
Austrian,01/07/2018,1,Max Verstappen,4,Red Bull Racing-TAG Heuer,25
|
||||
Austrian,01/07/2018,2,Kimi Räikkönen,3,Ferrari,18
|
||||
Austrian,01/07/2018,3,Sebastian Vettel,6,Ferrari,15
|
||||
Austrian,01/07/2018,4,Romain Grosjean,5,Haas-Ferrari,12
|
||||
Austrian,01/07/2018,5,Kevin Magnussen,8,Haas-Ferrari,10
|
||||
Austrian,01/07/2018,6,Esteban Ocon,11,Force India-Mercedes,8
|
||||
Austrian,01/07/2018,7,Sergio Pérez,15,Force India-Mercedes,6
|
||||
Austrian,01/07/2018,8,Fernando Alonso,20,McLaren-Renault,4
|
||||
Austrian,01/07/2018,9,Charles Leclerc,17,Sauber-Ferrari,2
|
||||
Austrian,01/07/2018,10,Marcus Ericsson,18,Sauber-Ferrari,1
|
||||
British,08/07/2018,1,Sebastian Vettel,2,Ferrari,25
|
||||
British,08/07/2018,2,Lewis Hamilton,1,Mercedes,18
|
||||
British,08/07/2018,3,Kimi Räikkönen,3,Ferrari,15
|
||||
British,08/07/2018,4,Valtteri Bottas,4,Mercedes,12
|
||||
British,08/07/2018,5,Daniel Ricciardo,6,Red Bull Racing-TAG Heuer,10
|
||||
British,08/07/2018,6,Nico Hülkenberg,11,Renault,8
|
||||
British,08/07/2018,7,Esteban Ocon,10,Force India-Mercedes,6
|
||||
British,08/07/2018,8,Fernando Alonso,13,McLaren-Renault,4
|
||||
British,08/07/2018,9,Kevin Magnussen,7,Haas-Ferrari,2
|
||||
British,08/07/2018,10,Sergio Pérez,12,Force India-Mercedes,1
|
||||
|
10
Examples/Grouping/GroupDate.ps1
Normal file
10
Examples/Grouping/GroupDate.ps1
Normal file
@@ -0,0 +1,10 @@
|
||||
$xlfile = "$env:TEMP\Points.xlsx"
|
||||
|
||||
Remove-Item $xlfile -ErrorAction SilentlyContinue
|
||||
|
||||
$PivotTableDefinition = New-PivotTableDefinition -Activate -PivotTableName Points `
|
||||
-PivotRows Driver, Date -PivotData @{Points = "SUM"} -GroupDateRow Date -GroupDatePart Years, Months
|
||||
|
||||
Import-Csv "$PSScriptRoot\First10Races.csv" |
|
||||
Select-Object Race, @{n = "Date"; e = {[datetime]::ParseExact($_.date, "dd/MM/yyyy", (Get-Culture))}}, FinishPosition, Driver, GridPosition, Team, Points |
|
||||
Export-Excel $xlfile -Show -AutoSize -PivotTableDefinition $PivotTableDefinition
|
||||
10
Examples/Grouping/GroupNumeric.ps1
Normal file
10
Examples/Grouping/GroupNumeric.ps1
Normal file
@@ -0,0 +1,10 @@
|
||||
$xlfile = "$env:TEMP\Places.xlsx"
|
||||
|
||||
Remove-Item $xlfile -ErrorAction SilentlyContinue
|
||||
|
||||
$PivotTableDefinition = New-PivotTableDefinition -Activate -PivotTableName Places `
|
||||
-PivotRows Driver, FinishPosition -PivotData @{Date = "Count"} -GroupNumericRow FinishPosition -GroupNumericMin 1 -GroupNumericMax 25 -GroupNumericInterval 3
|
||||
|
||||
Import-Csv "$PSScriptRoot\First10Races.csv" |
|
||||
Select-Object Race, @{n = "Date"; e = {[datetime]::ParseExact($_.date, "dd/MM/yyyy", (Get-Culture))}}, FinishPosition, Driver, GridPosition, Team, Points |
|
||||
Export-Excel $xlfile -Show -AutoSize -PivotTableDefinition $PivotTableDefinition
|
||||
39
Examples/Grouping/TimestampBucket.ps1
Normal file
39
Examples/Grouping/TimestampBucket.ps1
Normal file
@@ -0,0 +1,39 @@
|
||||
$data = ConvertFrom-Csv @"
|
||||
Timestamp,Tenant
|
||||
10/29/2018 3:00:00.123,1
|
||||
10/29/2018 3:00:10.456,1
|
||||
10/29/2018 3:01:20.389,1
|
||||
10/29/2018 3:00:30.222,1
|
||||
10/29/2018 3:00:40.143,1
|
||||
10/29/2018 3:00:50.809,1
|
||||
10/29/2018 3:01:00.193,1
|
||||
10/29/2018 3:01:10.555,1
|
||||
10/29/2018 3:01:20.739,1
|
||||
10/29/2018 3:01:30.912,1
|
||||
10/29/2018 3:01:40.989,1
|
||||
10/29/2018 3:01:50.545,1
|
||||
10/29/2018 3:02:00.999,1
|
||||
"@ | Select-Object @{n = 'Timestamp'; e = {get-date $_.timestamp}}, tenant, @{n = 'Bucket'; e = { - (get-date $_.timestamp).Second % 30}}
|
||||
|
||||
$f = "$env:temp\pivottest.xlsx"
|
||||
Remove-Item $f -ErrorAction SilentlyContinue
|
||||
|
||||
$pivotDefParams = @{
|
||||
PivotTableName = 'Timestamp Buckets'
|
||||
PivotRows = @('Timestamp', 'Tenant')
|
||||
PivotData = @{'Bucket' = 'count'}
|
||||
GroupDateRow = 'TimeStamp'
|
||||
GroupDatePart = @('Hours', 'Minutes')
|
||||
Activate = $true
|
||||
}
|
||||
|
||||
$excelParams = @{
|
||||
PivotTableDefinition = New-PivotTableDefinition @pivotDefParams
|
||||
Path = $f
|
||||
WorkSheetname = "Log Data"
|
||||
AutoSize = $true
|
||||
AutoFilter = $true
|
||||
Show = $true
|
||||
}
|
||||
|
||||
$data | Export-Excel @excelParams
|
||||
55
Examples/MortgageCalculator/MortgageCalculator.ps1
Normal file
55
Examples/MortgageCalculator/MortgageCalculator.ps1
Normal file
@@ -0,0 +1,55 @@
|
||||
<#
|
||||
Fixed Rate Loan/Mortgage Calculator in Excel
|
||||
#>
|
||||
|
||||
param(
|
||||
$Amount = 400000,
|
||||
$InterestRate = .065,
|
||||
$Term = 30
|
||||
)
|
||||
|
||||
function New-CellData {
|
||||
param(
|
||||
$Range,
|
||||
$Value,
|
||||
$Format
|
||||
)
|
||||
|
||||
$setFormatParams = @{
|
||||
WorkSheet = $ws
|
||||
Range = $Range
|
||||
NumberFormat = $Format
|
||||
}
|
||||
|
||||
if ($Value -is [string] -and $Value.StartsWith('=')) {
|
||||
$setFormatParams.Formula = $Value
|
||||
}
|
||||
else {
|
||||
$setFormatParams.Value = $Value
|
||||
}
|
||||
|
||||
Set-Format @setFormatParams
|
||||
}
|
||||
|
||||
$f = "$PSScriptRoot\mortgage.xlsx"
|
||||
Remove-Item $f -ErrorAction SilentlyContinue
|
||||
|
||||
$pkg = "" | Export-Excel $f -Title 'Fixed Rate Loan Payments' -PassThru -AutoSize
|
||||
$ws = $pkg.Workbook.Worksheets["Sheet1"]
|
||||
|
||||
New-CellData A3 'Amount'
|
||||
New-CellData B3 $Amount '$#,##0'
|
||||
|
||||
New-CellData A4 "Interest Rate"
|
||||
New-CellData B4 $InterestRate 'Percentage'
|
||||
|
||||
New-CellData A5 "Term (Years)"
|
||||
New-CellData B5 $Term
|
||||
|
||||
New-CellData D3 "Monthly Payment"
|
||||
New-CellData F3 "=-PMT(F4, B5*12, B3)" '$#,##0.#0'
|
||||
|
||||
New-CellData D4 "Monthly Rate"
|
||||
New-CellData F4 "=((1+B4)^(1/12))-1" 'Percentage'
|
||||
|
||||
Close-ExcelPackage $pkg -Show
|
||||
55
Examples/PivotTable/MultiplePivotTables.ps1
Normal file
55
Examples/PivotTable/MultiplePivotTables.ps1
Normal file
@@ -0,0 +1,55 @@
|
||||
$data = ConvertFrom-Csv @"
|
||||
Region,Date,Fruit,Sold
|
||||
North,1/1/2017,Pears,50
|
||||
South,1/1/2017,Pears,150
|
||||
East,4/1/2017,Grapes,100
|
||||
West,7/1/2017,Bananas,150
|
||||
South,10/1/2017,Apples,200
|
||||
North,1/1/2018,Pears,100
|
||||
East,4/1/2018,Grapes,200
|
||||
West,7/1/2018,Bananas,300
|
||||
South,10/1/2018,Apples,400
|
||||
"@ | Select-Object -Property Region, @{n = "Date"; e = {[datetime]::ParseExact($_.Date, "M/d/yyyy", (Get-Culture))}}, Fruit, Sold
|
||||
|
||||
$xlfile = "$env:temp\multiplePivotTables.xlsx"
|
||||
Remove-Item $xlfile -ErrorAction SilentlyContinue
|
||||
|
||||
$excel = $data | Export-Excel $xlfile -PassThru -AutoSize -TableName FruitData
|
||||
|
||||
$pivotTableParams = @{
|
||||
PivotTableName = "ByRegion"
|
||||
Address = $excel.Sheet1.cells["F1"]
|
||||
SourceWorkSheet = $excel.Sheet1
|
||||
PivotRows = echo Region Fruit Date
|
||||
PivotData = @{'sold' = 'sum'}
|
||||
PivotTableStyle = 'Light21'
|
||||
GroupDateRow = "Date"
|
||||
GroupDatePart = echo Years Quarters
|
||||
}
|
||||
|
||||
$pt = Add-PivotTable @pivotTableParams -PassThru
|
||||
#$pt.RowHeaderCaption ="By Region,Fruit,Date"
|
||||
$pt.RowHeaderCaption = "By " + ($pivotTableParams.PivotRows -join ",")
|
||||
|
||||
$pivotTableParams.PivotTableName = "ByFruit"
|
||||
$pivotTableParams.Address = $excel.Sheet1.cells["J1"]
|
||||
$pivotTableParams.PivotRows = echo Fruit Region Date
|
||||
|
||||
$pt = Add-PivotTable @pivotTableParams -PassThru
|
||||
$pt.RowHeaderCaption = "By Fruit,Region"
|
||||
|
||||
$pivotTableParams.PivotTableName = "ByDate"
|
||||
$pivotTableParams.Address = $excel.Sheet1.cells["N1"]
|
||||
$pivotTableParams.PivotRows = echo Date Region Fruit
|
||||
|
||||
$pt = Add-PivotTable @pivotTableParams -PassThru
|
||||
$pt.RowHeaderCaption = "By Date,Region,Fruit"
|
||||
|
||||
$pivotTableParams.PivotTableName = "ByYears"
|
||||
$pivotTableParams.Address = $excel.Sheet1.cells["S1"]
|
||||
$pivotTableParams.GroupDatePart = echo Years
|
||||
|
||||
$pt = Add-PivotTable @pivotTableParams -PassThru
|
||||
$pt.RowHeaderCaption = "By Years,Region"
|
||||
|
||||
Close-ExcelPackage $excel -Show
|
||||
@@ -674,6 +674,7 @@
|
||||
|
||||
$row = $ws.Dimension.End.Row
|
||||
Write-Debug -Message ("Appending: headers are " + ($script:Header -join ", ") + " Start row is $row")
|
||||
if ($Title) {Write-Warning -Message "-Title Parameter is ignored when appending."}
|
||||
}
|
||||
elseif ($Title) {
|
||||
#Can only add a title if not appending!
|
||||
@@ -1339,6 +1340,14 @@ function Add-ExcelTable {
|
||||
[Switch]$PassThru
|
||||
)
|
||||
try {
|
||||
if ([OfficeOpenXml.FormulaParsing.ExcelUtilities.ExcelAddressUtil]::IsValidAddress($TableName)) {
|
||||
Write-Warning -Message "$tableName reads as an Excel address, and so is not allowed as a table name."
|
||||
return
|
||||
}
|
||||
if ($tableName -notMatch '^[A-Z]') {
|
||||
Write-Warning -Message "$tableName is not allowed as a table name because it does not begin with a letter."
|
||||
return
|
||||
}
|
||||
if ($TableName -match "\W") {
|
||||
Write-Warning -Message "At least one character in $TableName is illegal in a table name and will be replaced with '_' . "
|
||||
$TableName = $TableName -replace '\W', '_'
|
||||
|
||||
28
Export-StocksToExcel.ps1
Normal file
28
Export-StocksToExcel.ps1
Normal file
@@ -0,0 +1,28 @@
|
||||
function Export-StocksToExcel {
|
||||
param(
|
||||
[string]$symbols,
|
||||
[ValidateSet("Open", "High", "Low", "Close", "Volume")]
|
||||
$measure = "Open"
|
||||
)
|
||||
|
||||
$xl = "$env:TEMP\Stocks.xlsx"
|
||||
|
||||
Remove-Item $xl -ErrorAction SilentlyContinue
|
||||
|
||||
$r = Invoke-RestMethod "https://azfnstockdata-fn83fffd32.azurewebsites.net/api/GetQuoteChart?symbol=$($symbols)"
|
||||
|
||||
$chartColumn = $symbols.Split(',').count + 2
|
||||
$ptd = New-PivotTableDefinition `
|
||||
-SourceWorkSheet Sheet1 `
|
||||
-PivotTableName result `
|
||||
-PivotData @{$measure = 'sum'} `
|
||||
-PivotRows date `
|
||||
-PivotColumns symbol `
|
||||
-ChartType Line `
|
||||
-ChartTitle "Stock - $measure " `
|
||||
-IncludePivotChart -NoTotalsInPivot -ChartColumn $chartColumn -ChartRow 3 -Activate
|
||||
|
||||
$r | Sort-Object Date, symbol | Export-Excel $xl -PivotTableDefinition $ptd -AutoSize -AutoFilter -Show
|
||||
}
|
||||
|
||||
# Export-StocksToExcel -symbols 'ibm,aapl,msft' -measure High
|
||||
BIN
ImportExcel-5.4.2-20181217155848.zip
Normal file
BIN
ImportExcel-5.4.2-20181217155848.zip
Normal file
Binary file not shown.
@@ -4,7 +4,7 @@
|
||||
RootModule = 'ImportExcel.psm1'
|
||||
|
||||
# Version number of this module.
|
||||
ModuleVersion = '5.4.0'
|
||||
ModuleVersion = '5.4.3'
|
||||
|
||||
# ID used to uniquely identify this module
|
||||
GUID = '60dd4136-feff-401a-ba27-a84458c57ede'
|
||||
|
||||
187
ImportExcel.psm1
187
ImportExcel.psm1
@@ -1,62 +1,64 @@
|
||||
#region import everything we need
|
||||
Add-Type -Path "$($PSScriptRoot)\EPPlus.dll"
|
||||
. $PSScriptRoot\AddConditionalFormatting.ps1
|
||||
. $PSScriptRoot\Charting.ps1
|
||||
. $PSScriptRoot\ColorCompletion.ps1
|
||||
. $PSScriptRoot\ConvertExcelToImageFile.ps1
|
||||
. $PSScriptRoot\Compare-WorkSheet.ps1
|
||||
. $PSScriptRoot\ConvertFromExcelData.ps1
|
||||
. $PSScriptRoot\ConvertFromExcelToSQLInsert.ps1
|
||||
. $PSScriptRoot\ConvertToExcelXlsx.ps1
|
||||
. $PSScriptRoot\Copy-ExcelWorkSheet.ps1
|
||||
. $PSScriptRoot\Export-Excel.ps1
|
||||
. $PSScriptRoot\Export-ExcelSheet.ps1
|
||||
. $PSScriptRoot\Get-ExcelColumnName.ps1
|
||||
. $PSScriptRoot\Get-ExcelSheetInfo.ps1
|
||||
. $PSScriptRoot\Get-ExcelWorkbookInfo.ps1
|
||||
. $PSScriptRoot\Get-HtmlTable.ps1
|
||||
. $PSScriptRoot\Get-Range.ps1
|
||||
. $PSScriptRoot\Get-XYRange.ps1
|
||||
. $PSScriptRoot\Import-Html.ps1
|
||||
. $PSScriptRoot\InferData.ps1
|
||||
. $PSScriptRoot\Invoke-Sum.ps1
|
||||
. $PSScriptRoot\Join-WorkSheet.ps1
|
||||
. $PSScriptRoot\Merge-Worksheet.ps1
|
||||
. $PSScriptRoot\New-ConditionalFormattingIconSet.ps1
|
||||
. $PSScriptRoot\New-ConditionalText.ps1
|
||||
. $PSScriptRoot\New-ExcelChart.ps1
|
||||
. $PSScriptRoot\New-PSItem.ps1
|
||||
. $PSScriptRoot\Open-ExcelPackage.ps1
|
||||
. $PSScriptRoot\Pivot.ps1
|
||||
. $PSScriptRoot\PivotTable.ps1
|
||||
. $PSScriptRoot\Send-SQLDataToExcel.ps1
|
||||
. $PSScriptRoot\Set-CellStyle.ps1
|
||||
. $PSScriptRoot\Set-Column.ps1
|
||||
. $PSScriptRoot\Set-Row.ps1
|
||||
. $PSScriptRoot\SetFormat.ps1
|
||||
. $PSScriptRoot\TrackingUtils.ps1
|
||||
. $PSScriptRoot\Update-FirstObjectProperties.ps1
|
||||
Add-Type -Path "$($PSScriptRoot)\EPPlus.dll"
|
||||
. $PSScriptRoot\AddConditionalFormatting.ps1
|
||||
. $PSScriptRoot\Charting.ps1
|
||||
. $PSScriptRoot\ColorCompletion.ps1
|
||||
. $PSScriptRoot\ConvertExcelToImageFile.ps1
|
||||
. $PSScriptRoot\Compare-WorkSheet.ps1
|
||||
. $PSScriptRoot\ConvertFromExcelData.ps1
|
||||
. $PSScriptRoot\ConvertFromExcelToSQLInsert.ps1
|
||||
. $PSScriptRoot\ConvertToExcelXlsx.ps1
|
||||
. $PSScriptRoot\Copy-ExcelWorkSheet.ps1
|
||||
. $PSScriptRoot\Export-Excel.ps1
|
||||
. $PSScriptRoot\Export-ExcelSheet.ps1
|
||||
. $PSScriptRoot\Export-StocksToExcel.ps1
|
||||
. $PSScriptRoot\Get-ExcelColumnName.ps1
|
||||
. $PSScriptRoot\Get-ExcelSheetInfo.ps1
|
||||
. $PSScriptRoot\Get-ExcelWorkbookInfo.ps1
|
||||
. $PSScriptRoot\Get-HtmlTable.ps1
|
||||
. $PSScriptRoot\Get-Range.ps1
|
||||
. $PSScriptRoot\Get-XYRange.ps1
|
||||
. $PSScriptRoot\Import-Html.ps1
|
||||
. $PSScriptRoot\InferData.ps1
|
||||
. $PSScriptRoot\Invoke-Sum.ps1
|
||||
. $PSScriptRoot\Join-WorkSheet.ps1
|
||||
. $PSScriptRoot\Merge-Worksheet.ps1
|
||||
. $PSScriptRoot\New-ConditionalFormattingIconSet.ps1
|
||||
. $PSScriptRoot\New-ConditionalText.ps1
|
||||
. $PSScriptRoot\New-ExcelChart.ps1
|
||||
. $PSScriptRoot\New-PSItem.ps1
|
||||
. $PSScriptRoot\Open-ExcelPackage.ps1
|
||||
. $PSScriptRoot\Pivot.ps1
|
||||
. $PSScriptRoot\PivotTable.ps1
|
||||
. $PSScriptRoot\RemoveWorksheet.ps1
|
||||
. $PSScriptRoot\Send-SQLDataToExcel.ps1
|
||||
. $PSScriptRoot\Set-CellStyle.ps1
|
||||
. $PSScriptRoot\Set-Column.ps1
|
||||
. $PSScriptRoot\Set-Row.ps1
|
||||
. $PSScriptRoot\SetFormat.ps1
|
||||
. $PSScriptRoot\TrackingUtils.ps1
|
||||
. $PSScriptRoot\Update-FirstObjectProperties.ps1
|
||||
|
||||
|
||||
New-Alias -Name Use-ExcelData -Value "ConvertFrom-ExcelData" -Force
|
||||
New-Alias -Name Use-ExcelData -Value "ConvertFrom-ExcelData" -Force
|
||||
|
||||
if ($PSVersionTable.PSVersion.Major -ge 5) {
|
||||
. $PSScriptRoot\Plot.ps1
|
||||
if ($PSVersionTable.PSVersion.Major -ge 5) {
|
||||
. $PSScriptRoot\Plot.ps1
|
||||
|
||||
Function New-Plot {
|
||||
Param()
|
||||
|
||||
[PSPlot]::new()
|
||||
}
|
||||
Function New-Plot {
|
||||
Param()
|
||||
|
||||
[PSPlot]::new()
|
||||
}
|
||||
else {
|
||||
Write-Warning 'PowerShell 5 is required for plot.ps1'
|
||||
Write-Warning 'PowerShell Excel is ready, except for that functionality'
|
||||
}
|
||||
|
||||
}
|
||||
else {
|
||||
Write-Warning 'PowerShell 5 is required for plot.ps1'
|
||||
Write-Warning 'PowerShell Excel is ready, except for that functionality'
|
||||
}
|
||||
#endregion
|
||||
function Import-Excel {
|
||||
<#
|
||||
<#
|
||||
.SYNOPSIS
|
||||
Create custom objects from the rows in an Excel worksheet.
|
||||
|
||||
@@ -247,7 +249,7 @@ function Import-Excel {
|
||||
Write-SqlTableData -ServerInstance localhost\DEFAULT -Database BlankDB -SchemaName dbo -TableName MyNewTable_fromExcel -Force
|
||||
|
||||
Imports data from an Excel file and pipe the data to the Write-SqlTableData to be INSERTed into a table in a SQL Server database.
|
||||
The ",( ... )" around the Import-Excel command allows all rows to be imported from the Excel file, prior to pipelining to the Write-SqlTableData cmdlet. This helps prevent a RBAR scenario and is important when trying to import thousands of rows.
|
||||
The ",( ... )" around the Import-Excel command allows all rows to be imported from the Excel file, prior to pipelining to the Write-SqlTableData cmdlet. This helps prevent a RBAR scenario and is important when trying to import thousands of rows.
|
||||
The -Force parameter will be ignored if the table already exists. However, if a table is not found that matches the values provided by -SchemaName and -TableName parameters, it will create a new table in SQL Server database. The Write-SqlTableData cmdlet will inherit the column names & datatypes for the new table from the object being piped in.
|
||||
NOTE: You need to install the SqlServer module from the PowerShell Gallery in oder to get the Write-SqlTableData cmdlet.
|
||||
|
||||
@@ -258,24 +260,24 @@ function Import-Excel {
|
||||
#>
|
||||
|
||||
[CmdLetBinding(DefaultParameterSetName)]
|
||||
[Diagnostics.CodeAnalysis.SuppressMessageAttribute("PSAvoidUsingPlainTextForPassword","")]
|
||||
[Diagnostics.CodeAnalysis.SuppressMessageAttribute("PSAvoidUsingPlainTextForPassword", "")]
|
||||
Param (
|
||||
[Alias('FullName')]
|
||||
[Parameter(ValueFromPipelineByPropertyName, ValueFromPipeline, Position=0, Mandatory)]
|
||||
[Parameter(ValueFromPipelineByPropertyName, ValueFromPipeline, Position = 0, Mandatory)]
|
||||
[ValidateScript( {(Test-Path -Path $_ -PathType Leaf) -and ($_ -match '.xls$|.xlsx$|.xlsm$')})]
|
||||
[String]$Path,
|
||||
[Alias('Sheet')]
|
||||
[Parameter(Position=1)]
|
||||
[Parameter(Position = 1)]
|
||||
[ValidateNotNullOrEmpty()]
|
||||
[String]$WorksheetName,
|
||||
[Parameter(ParameterSetName='B', Mandatory)]
|
||||
[Parameter(ParameterSetName = 'B', Mandatory)]
|
||||
[String[]]$HeaderName ,
|
||||
[Parameter(ParameterSetName='C', Mandatory)]
|
||||
[Parameter(ParameterSetName = 'C', Mandatory)]
|
||||
[Switch]$NoHeader ,
|
||||
[Alias('HeaderRow','TopRow')]
|
||||
[Alias('HeaderRow', 'TopRow')]
|
||||
[ValidateRange(1, 9999)]
|
||||
[Int]$StartRow = 1,
|
||||
[Alias('StopRow','BottomRow')]
|
||||
[Alias('StopRow', 'BottomRow')]
|
||||
[Int]$EndRow ,
|
||||
[Alias('LeftColumn')]
|
||||
[Int]$StartColumn = 1,
|
||||
@@ -305,13 +307,13 @@ function Import-Excel {
|
||||
$i = 0
|
||||
foreach ($C in $Columns) {
|
||||
$i++
|
||||
$C | Select-Object @{N='Column'; E={$_}}, @{N='Value'; E={'P' + $i}}
|
||||
$C | Select-Object @{N = 'Column'; E = {$_}}, @{N = 'Value'; E = {'P' + $i}}
|
||||
}
|
||||
}
|
||||
elseif ($HeaderName) {
|
||||
$i = 0
|
||||
foreach ($H in $HeaderName) {
|
||||
$H | Select-Object @{N='Column'; E={$Columns[$i]}}, @{N='Value'; E={$H}}
|
||||
$H | Select-Object @{N = 'Column'; E = {$Columns[$i]}}, @{N = 'Value'; E = {$H}}
|
||||
$i++
|
||||
}
|
||||
}
|
||||
@@ -321,7 +323,7 @@ function Import-Excel {
|
||||
}
|
||||
|
||||
foreach ($C in $Columns) {
|
||||
$Worksheet.Cells[$StartRow,$C] | Where-Object {$_.Value} | Select-Object @{N='Column'; E={$C}}, Value
|
||||
$Worksheet.Cells[$StartRow, $C] | Where-Object {$_.Value} | Select-Object @{N = 'Column'; E = {$C}}, Value
|
||||
}
|
||||
}
|
||||
}
|
||||
@@ -341,12 +343,14 @@ function Import-Excel {
|
||||
Catch {throw "Could not open $Path ; $_ "}
|
||||
|
||||
if ($Password) {
|
||||
Try {$Excel = New-Object -TypeName OfficeOpenXml.ExcelPackage
|
||||
$excel.Load( $Stream,$Password)}
|
||||
Try {
|
||||
$Excel = New-Object -TypeName OfficeOpenXml.ExcelPackage
|
||||
$excel.Load( $Stream, $Password)
|
||||
}
|
||||
Catch { throw "Could not read $Path with the provided password." }
|
||||
}
|
||||
else {
|
||||
try {$Excel = New-Object -TypeName OfficeOpenXml.ExcelPackage -ArgumentList $Stream}
|
||||
try {$Excel = New-Object -TypeName OfficeOpenXml.ExcelPackage -ArgumentList $Stream}
|
||||
Catch {throw "Failed to read $Path"}
|
||||
}
|
||||
#endregion
|
||||
@@ -364,13 +368,13 @@ function Import-Excel {
|
||||
Write-Debug $sw.Elapsed.TotalMilliseconds
|
||||
#region Get rows and columns
|
||||
#If we are doing dataonly it is quicker to work out which rows to ignore before processing the cells.
|
||||
if (-not $EndRow ) {$EndRow = $Worksheet.Dimension.End.Row }
|
||||
if (-not $EndRow ) {$EndRow = $Worksheet.Dimension.End.Row }
|
||||
if (-not $EndColumn) {$EndColumn = $Worksheet.Dimension.End.Column }
|
||||
$endAddress = [OfficeOpenXml.ExcelAddress]::TranslateFromR1C1("R[$EndRow]C[$EndColumn]",0,0)
|
||||
$endAddress = [OfficeOpenXml.ExcelAddress]::TranslateFromR1C1("R[$EndRow]C[$EndColumn]", 0, 0)
|
||||
if ($DataOnly) {
|
||||
#If we are using headers startrow will be the headerrow so examine data from startRow + 1,
|
||||
if ($NoHeader) {$range = "A" + ($StartRow ) + ":" + $endAddress }
|
||||
else {$range = "A" + ($StartRow + 1 ) + ":" + $endAddress }
|
||||
else {$range = "A" + ($StartRow + 1 ) + ":" + $endAddress }
|
||||
#We're going to look at every cell and build 2 hash tables holding rows & columns which contain data.
|
||||
#Want to Avoid 'select unique' operations & large Sorts, becuse time time taken increases with square
|
||||
#of number of items (PS uses heapsort at large size). Instead keep a list of what we have seen,
|
||||
@@ -378,15 +382,15 @@ function Import-Excel {
|
||||
$colHash = @{}
|
||||
$rowHash = @{}
|
||||
foreach ($cell in $Worksheet.Cells[$range]) {
|
||||
if ($null -ne $cell.Value ) {$colHash[$cell.Start.Column]=1; $rowHash[$cell.Start.row]=1 }
|
||||
if ($null -ne $cell.Value ) {$colHash[$cell.Start.Column] = 1; $rowHash[$cell.Start.row] = 1 }
|
||||
}
|
||||
$rows = ( $StartRow..$EndRow ).Where({$rowHash[$_]})
|
||||
$columns = ($StartColumn..$EndColumn).Where({$colHash[$_]})
|
||||
$rows = ( $StartRow..$EndRow ).Where( {$rowHash[$_]})
|
||||
$columns = ($StartColumn..$EndColumn).Where( {$colHash[$_]})
|
||||
}
|
||||
else {
|
||||
$Columns = $StartColumn..$EndColumn ; if ($StartColumn -gt $EndColumn) {Write-Warning -Message "Selecting columns $StartColumn to $EndColumn might give odd results."}
|
||||
if ($NoHeader) {$Rows = ( $StartRow)..$EndRow ; if ($StartRow -gt $EndRow) {Write-Warning -Message "Selecting rows $StartRow to $EndRow might give odd results."} }
|
||||
else {$Rows = (1 + $StartRow)..$EndRow ; if ($StartRow -ge $EndRow) {Write-Warning -Message "Selecting $StartRow as the header with data in $(1+$StartRow) to $EndRow might give odd results."}}
|
||||
}
|
||||
#endregion
|
||||
#region Create property names
|
||||
@@ -404,13 +408,13 @@ function Import-Excel {
|
||||
else {
|
||||
#region Create one object per row
|
||||
foreach ($R in $Rows) {
|
||||
#Disabled write-verbose for speed
|
||||
# Write-Verbose "Import row '$R'"
|
||||
#Disabled write-verbose for speed
|
||||
# Write-Verbose "Import row '$R'"
|
||||
$NewRow = [Ordered]@{}
|
||||
|
||||
foreach ($P in $PropertyNames) {
|
||||
$NewRow[$P.Value] = $Worksheet.Cells[$R, $P.Column].Value
|
||||
# Write-Verbose "Import cell '$($Worksheet.Cells[$R, $P.Column].Address)' with property name '$($p.Value)' and value '$($Worksheet.Cells[$R, $P.Column].Value)'."
|
||||
$NewRow[$P.Value] = $Worksheet.Cells[$R, $P.Column].Value
|
||||
# Write-Verbose "Import cell '$($Worksheet.Cells[$R, $P.Column].Address)' with property name '$($p.Value)' and value '$($Worksheet.Cells[$R, $P.Column].Value)'."
|
||||
}
|
||||
|
||||
[PSCustomObject]$NewRow
|
||||
@@ -455,11 +459,11 @@ function ConvertFrom-ExcelSheet {
|
||||
[String]
|
||||
$OutputPath = '.\',
|
||||
[String]
|
||||
$SheetName="*",
|
||||
[ValidateSet('ASCII', 'BigEndianUniCode','Default','OEM','UniCode','UTF32','UTF7','UTF8')]
|
||||
$SheetName = "*",
|
||||
[ValidateSet('ASCII', 'BigEndianUniCode', 'Default', 'OEM', 'UniCode', 'UTF32', 'UTF7', 'UTF8')]
|
||||
[string]
|
||||
$Encoding = 'UTF8',
|
||||
[ValidateSet('.txt', '.log','.csv')]
|
||||
[ValidateSet('.txt', '.log', '.csv')]
|
||||
[string]
|
||||
$Extension = '.csv',
|
||||
[ValidateSet(';', ',')]
|
||||
@@ -468,7 +472,7 @@ function ConvertFrom-ExcelSheet {
|
||||
)
|
||||
|
||||
$Path = (Resolve-Path $Path).Path
|
||||
$stream = New-Object -TypeName System.IO.FileStream -ArgumentList $Path,"Open","Read","ReadWrite"
|
||||
$stream = New-Object -TypeName System.IO.FileStream -ArgumentList $Path, "Open", "Read", "ReadWrite"
|
||||
$xl = New-Object -TypeName OfficeOpenXml.ExcelPackage -ArgumentList $stream
|
||||
$workbook = $xl.Workbook
|
||||
|
||||
@@ -480,8 +484,7 @@ function ConvertFrom-ExcelSheet {
|
||||
$params.Remove('Extension')
|
||||
$params.NoTypeInformation = $true
|
||||
|
||||
Foreach ($sheet in $targetSheets)
|
||||
{
|
||||
Foreach ($sheet in $targetSheets) {
|
||||
Write-Verbose "Exporting sheet: $($sheet.Name)"
|
||||
|
||||
$params.Path = "$OutputPath\$($Sheet.Name)$Extension"
|
||||
@@ -495,18 +498,18 @@ function ConvertFrom-ExcelSheet {
|
||||
}
|
||||
|
||||
function Export-MultipleExcelSheets {
|
||||
[Diagnostics.CodeAnalysis.SuppressMessageAttribute("PSAvoidUsingPlainTextForPassword","")]
|
||||
[Diagnostics.CodeAnalysis.SuppressMessageAttribute("PSAvoidUsingPlainTextForPassword", "")]
|
||||
param(
|
||||
[Parameter(Mandatory=$true)]
|
||||
[Parameter(Mandatory = $true)]
|
||||
$Path,
|
||||
[Parameter(Mandatory=$true)]
|
||||
[Parameter(Mandatory = $true)]
|
||||
[hashtable]$InfoMap,
|
||||
[string]$Password,
|
||||
[Switch]$Show,
|
||||
[Switch]$AutoSize
|
||||
)
|
||||
|
||||
$parameters = @{}+$PSBoundParameters
|
||||
$parameters = @{} + $PSBoundParameters
|
||||
$parameters.Remove("InfoMap")
|
||||
$parameters.Remove("Show")
|
||||
|
||||
@@ -514,24 +517,24 @@ function Export-MultipleExcelSheets {
|
||||
|
||||
foreach ($entry in $InfoMap.GetEnumerator()) {
|
||||
Write-Progress -Activity "Exporting" -Status "$($entry.Key)"
|
||||
$parameters.WorkSheetname=$entry.Key
|
||||
$parameters.WorkSheetname = $entry.Key
|
||||
|
||||
& $entry.Value | Export-Excel @parameters
|
||||
}
|
||||
|
||||
if($Show) {Invoke-Item $Path}
|
||||
if ($Show) {Invoke-Item $Path}
|
||||
}
|
||||
|
||||
Function WorksheetArgumentCompleter {
|
||||
param($commandName, $parameterName, $wordToComplete, $commandAst, $fakeBoundParameter)
|
||||
$xlPath = $fakeBoundParameter['Path']
|
||||
$xlPath = $fakeBoundParameter['Path']
|
||||
if (Test-Path -Path $xlPath) {
|
||||
$xlpkg = Open-ExcelPackage -Path $xlPath
|
||||
$WorksheetNames = $xlPkg.Workbook.Worksheets.Name
|
||||
Close-ExcelPackage -nosave -ExcelPackage $xlpkg
|
||||
$WorksheetNames.where({$_ -like "*$wordToComplete*"}) | foreach-object {
|
||||
$WorksheetNames.where( {$_ -like "*$wordToComplete*"}) | foreach-object {
|
||||
New-Object -TypeName System.Management.Automation.CompletionResult -ArgumentList "'$_'",
|
||||
$_ , ([System.Management.Automation.CompletionResultType]::ParameterValue) ,$_
|
||||
$_ , ([System.Management.Automation.CompletionResultType]::ParameterValue) , $_
|
||||
}
|
||||
}
|
||||
}
|
||||
|
||||
@@ -36,8 +36,8 @@ function New-ConditionalText {
|
||||
|
||||
This builds on the previous example, and specifies a condition of <=3 with
|
||||
a format of red text on a white background; this applies to a named range
|
||||
"Finish Position". The range could be written "C:C" to specify a named
|
||||
column, or "C2:C102" to specify certain cells in the column.
|
||||
"Finish Position". The range could be written -Range "C:C" to specify a
|
||||
named column, or -Range "C2:C102" to specify certain cells in the column.
|
||||
.Link
|
||||
Add-Add-ConditionalFormatting
|
||||
New-ConditionalFormattingIconSet
|
||||
|
||||
186
PivotTable.ps1
186
PivotTable.ps1
@@ -38,9 +38,53 @@
|
||||
but here -Address is specified to place it beside the data. The Add-Pivot table is given the chart definition and told to create a tale
|
||||
using the City field to create rows, the Product field to create columns and the data should be the sum of the gross field and the sum of the net field;
|
||||
grand totals for both gross and net are included for rows (Cities) and columns (product) and the data is explicitly formatted as a currency.
|
||||
Not that in the chart definition the number format for the axis does not include any fraction part.
|
||||
Note that in the chart definition the number format for the axis does not include any fraction part.
|
||||
.Example
|
||||
>
|
||||
$excel = Convertfrom-csv @"
|
||||
Location,OrderDate,quantity
|
||||
Boston,1/1/2017,100
|
||||
New York,1/21/2017,200
|
||||
Boston,1/11/2017,300
|
||||
New York,1/9/2017,400
|
||||
Boston,1/18/2017,500
|
||||
Boston,2/1/2017,600
|
||||
New York,2/21/2017,700
|
||||
New York,2/11/2017,800
|
||||
Boston,2/9/2017,900
|
||||
Boston,2/18/2017,1000
|
||||
New York,1/1/2018,100
|
||||
Boston,1/21/2018,200
|
||||
New York,1/11/2018,300
|
||||
Boston,1/9/2018,400
|
||||
New York,1/18/2018,500
|
||||
Boston,2/1/2018,600
|
||||
Boston,2/21/2018,700
|
||||
New York,2/11/2018,800
|
||||
New York,2/9/2018,900
|
||||
Boston,2/18/2018,1000
|
||||
"@ | Select-Object -Property @{n="OrderDate";e={[datetime]::ParseExact($_.OrderDate,"M/d/yyyy",(Get-Culture))}},
|
||||
Location, Quantity | Export-Excel "test2.xlsx" -PassThru -AutoSize
|
||||
|
||||
Set-ExcelColumn -Worksheet $excel.sheet1 -Column 1 -NumberFormat 'Short Date'
|
||||
|
||||
$pt = Add-PivotTable -PassThru -PivotTableName "ByDate" -Address $excel.Sheet1.cells["F1"] -SourceWorkSheet $excel.Sheet1 -PivotRows location,orderdate -PivotData @{'quantity'='sum'} -GroupDateRow orderdate -GroupDatePart 'Months,Years' -PivotTotals None
|
||||
$pt.RowFields[0].SubtotalTop=$false
|
||||
$pt.RowFields[0].Compact=$false
|
||||
Close-ExcelPackage $excel -Show
|
||||
|
||||
Here the data contains dates formatted as strings using US format. These
|
||||
are converted to DateTime objects before being exported to Excel; the
|
||||
"OrderDate" column is formatted with the local short-date style. Then
|
||||
the PivotTable is added; it groups information by date and location, the
|
||||
date is split into years and then months. No grand totals are displayed.
|
||||
The Pivot table object is caught in a variable, and the "Location"
|
||||
column has its subtotal moved from the top to the bottom of each location
|
||||
section, and the "Compact" option is disabled to prevent "Year" moving
|
||||
into the same column as location.
|
||||
Finally the workbook is saved and shown in Excel.
|
||||
#>
|
||||
[cmdletbinding(defaultParameterSetName='ChartbyParams')]
|
||||
[cmdletbinding(defaultParameterSetName = 'ChartbyParams')]
|
||||
[OutputType([OfficeOpenXml.Table.PivotTable.ExcelPivotTable])]
|
||||
param (
|
||||
#Name for the new PivotTable - this will be the name of a sheet in the Workbook.
|
||||
@@ -67,52 +111,64 @@
|
||||
#If there are multiple data items in a PivotTable, by default they are shown on separate rows; this switch makes them separate columns.
|
||||
[Switch]$PivotDataToColumn,
|
||||
#Define whether totals should be added to rows, columns neither, or both (the default is both).
|
||||
[ValidateSet("Both","Columns","Rows","None")]
|
||||
[ValidateSet("Both", "Columns", "Rows", "None")]
|
||||
[String]$PivotTotals = "Both",
|
||||
#Included for compatibility - equivalent to -PivotTotals "None".
|
||||
[Switch]$NoTotalsInPivot,
|
||||
#The name of a row field which should be grouped by parts of the date/time (ignored if GroupDateRow is not specified)
|
||||
[String]$GroupDateRow,
|
||||
#The Part(s) of the date to use in the grouping (ignored if GroupDateRow is not specified)
|
||||
[OfficeOpenXml.Table.PivotTable.eDateGroupBy[]]$GroupDatePart,
|
||||
#The name of a row field which should be grouped by Number (e.g 0-99, 100-199, 200-299 )
|
||||
[String]$GroupNumericRow,
|
||||
#The starting point for grouping
|
||||
[double]$GroupNumericMin = 0 ,
|
||||
#The endpoint for grouping
|
||||
[double]$GroupNumericMax = [Double]::MaxValue ,
|
||||
#The interval for grouping
|
||||
[double]$GroupNumericInterval = 100 ,
|
||||
#Number format to apply to the data cells in the PivotTable.
|
||||
[string]$PivotNumberFormat,
|
||||
#Apply a table style to the PivotTable.
|
||||
[OfficeOpenXml.Table.TableStyles]$PivotTableStyle,
|
||||
#Use a chart definition instead of specifying chart settings one by one.
|
||||
[Parameter(ParameterSetName='ChartbyDef', Mandatory=$true, ValueFromPipelineByPropertyName=$true)]
|
||||
[Parameter(ParameterSetName = 'ChartbyDef', Mandatory = $true, ValueFromPipelineByPropertyName = $true)]
|
||||
$PivotChartDefinition,
|
||||
#If specified, a chart will be included.
|
||||
[Parameter(ParameterSetName='ChartbyParams')]
|
||||
[Parameter(ParameterSetName = 'ChartbyParams')]
|
||||
[Switch]$IncludePivotChart,
|
||||
#Optional title for the pivot chart, by default the title omitted.
|
||||
[Parameter(ParameterSetName='ChartbyParams')]
|
||||
[Parameter(ParameterSetName = 'ChartbyParams')]
|
||||
[String]$ChartTitle = "",
|
||||
#Height of the chart in Pixels (400 by default).
|
||||
[Parameter(ParameterSetName='ChartbyParams')]
|
||||
[Parameter(ParameterSetName = 'ChartbyParams')]
|
||||
[int]$ChartHeight = 400 ,
|
||||
#Width of the chart in Pixels (600 by default).
|
||||
[Parameter(ParameterSetName='ChartbyParams')]
|
||||
[Parameter(ParameterSetName = 'ChartbyParams')]
|
||||
[int]$ChartWidth = 600,
|
||||
#Cell position of the top left corner of the chart, there will be this number of rows above the top edge of the chart (default is 0, chart starts at top edge of row 1).
|
||||
[Parameter(ParameterSetName='ChartbyParams')]
|
||||
[Parameter(ParameterSetName = 'ChartbyParams')]
|
||||
[Int]$ChartRow = 0 ,
|
||||
#Cell position of the top left corner of the chart, there will be this number of cells to the left of the chart (default is 4, chart starts at left edge of column E).
|
||||
[Parameter(ParameterSetName='ChartbyParams')]
|
||||
[Parameter(ParameterSetName = 'ChartbyParams')]
|
||||
[Int]$ChartColumn = 4,
|
||||
#Vertical offset of the chart from the cell corner.
|
||||
[Parameter(ParameterSetName='ChartbyParams')]
|
||||
[Parameter(ParameterSetName = 'ChartbyParams')]
|
||||
[Int]$ChartRowOffSetPixels = 0 ,
|
||||
[Parameter(ParameterSetName='ChartbyParams')]
|
||||
[Parameter(ParameterSetName = 'ChartbyParams')]
|
||||
#Horizontal offset of the chart from the cell corner.
|
||||
[Int]$ChartColumnOffSetPixels = 0,
|
||||
#Type of chart; defaults to "Pie".
|
||||
[Parameter(ParameterSetName='ChartbyParams')]
|
||||
[Parameter(ParameterSetName = 'ChartbyParams')]
|
||||
[OfficeOpenXml.Drawing.Chart.eChartType]$ChartType = 'Pie',
|
||||
#If specified hides the chart legend.
|
||||
[Parameter(ParameterSetName='ChartbyParams')]
|
||||
[Parameter(ParameterSetName = 'ChartbyParams')]
|
||||
[Switch]$NoLegend,
|
||||
#If specified attaches the category to slices in a pie chart : not supported on all chart types, this may give errors if applied to an unsupported type.
|
||||
[Parameter(ParameterSetName='ChartbyParams')]
|
||||
[Parameter(ParameterSetName = 'ChartbyParams')]
|
||||
[Switch]$ShowCategory,
|
||||
#If specified attaches percentages to slices in a pie chart.
|
||||
[Parameter(ParameterSetName='ChartbyParams')]
|
||||
[Parameter(ParameterSetName = 'ChartbyParams')]
|
||||
[Switch]$ShowPercent,
|
||||
#If there is already content in the workbook the sheet with the PivotTable will not be active UNLESS Activate is specified.
|
||||
[switch]$Activate,
|
||||
@@ -121,7 +177,7 @@
|
||||
)
|
||||
if ($PivotTableName.length -gt 250) {
|
||||
Write-warning -Message "PivotTable name will be truncated"
|
||||
$PivotTableName = $PivotTableName.Substring(0,250)
|
||||
$PivotTableName = $PivotTableName.Substring(0, 250)
|
||||
}
|
||||
if ($Address) {
|
||||
[OfficeOpenXml.ExcelWorksheet]$wsPivot = $address.Worksheet
|
||||
@@ -131,7 +187,7 @@
|
||||
if (-not $ExcelPackage) {Write-Warning -message "This combination of Parameters needs to include the ExcelPackage." ; return }
|
||||
[OfficeOpenXml.ExcelWorksheet]$wsPivot = Add-WorkSheet -ExcelPackage $ExcelPackage -WorksheetName $pivotTableName -Activate:$Activate
|
||||
if ($wsPivot.Name -ne $PivotTableName) {Write-Warning -Message "The Worksheet name for the PivotTable does not match the table name '$PivotTableName'; probably because excess or illegal characters were removed." }
|
||||
if ($PivotFilter) {$Address = $wsPivot.Cells["A3"]} else { $Address = $wsPivot.Cells["A1"]}
|
||||
if ($PivotFilter) {$Address = $wsPivot.Cells["A3"]} else { $Address = $wsPivot.Cells["A1"]}
|
||||
}
|
||||
catch {throw "Could not create the sheet for the PivotTable. $_" }
|
||||
}
|
||||
@@ -140,25 +196,25 @@
|
||||
if (-not $wsPivot.PivotTables[$pivotTableName] ) {
|
||||
try {
|
||||
#Accept a string or a worksheet object as $SourceWorksheet - we don't need a worksheet if we have a Rangebase .
|
||||
if ( $SourceWorkSheet -is [string]) {
|
||||
$SourceWorkSheet = $ExcelPackage.Workbook.Worksheets.where( {$_.name -Like $SourceWorkSheet})[0]
|
||||
if ( $SourceWorkSheet -is [string]) {
|
||||
$SourceWorkSheet = $ExcelPackage.Workbook.Worksheets.where( {$_.name -Like $SourceWorkSheet})[0]
|
||||
}
|
||||
elseif ( $SourceWorkSheet -is [int] ) {
|
||||
$SourceWorkSheet = $ExcelPackage.Workbook.Worksheets[$SourceWorkSheet]
|
||||
elseif ( $SourceWorkSheet -is [int] ) {
|
||||
$SourceWorkSheet = $ExcelPackage.Workbook.Worksheets[$SourceWorkSheet]
|
||||
}
|
||||
if ( $SourceRange -is [OfficeOpenXml.Table.ExcelTable]) {$SourceRange = $SourceRange.Address }
|
||||
if ( $sourceRange -is [OfficeOpenXml.ExcelRange] -or
|
||||
$SourceRange -is [OfficeOpenXml.ExcelAddress]) {
|
||||
if ( $SourceRange -is [OfficeOpenXml.Table.ExcelTable]) {$SourceRange = $SourceRange.Address }
|
||||
if ( $sourceRange -is [OfficeOpenXml.ExcelRange] -or
|
||||
$SourceRange -is [OfficeOpenXml.ExcelAddress]) {
|
||||
$pivotTable = $wsPivot.PivotTables.Add($Address, $SourceRange, $pivotTableName)
|
||||
}
|
||||
elseif (-not $SourceRange) {
|
||||
$pivotTable = $wsPivot.PivotTables.Add($Address, $SourceWorkSheet.cells[$SourceWorkSheet.Dimension.Address], $pivotTableName)
|
||||
}
|
||||
elseif ($SourceWorkSheet -isnot [OfficeOpenXml.ExcelWorksheet] ) {
|
||||
elseif ($SourceWorkSheet -isnot [OfficeOpenXml.ExcelWorksheet] ) {
|
||||
Write-Warning -Message "Could not find source Worksheet for pivot-table '$pivotTableName'." ; return
|
||||
}
|
||||
elseif ( $SourceRange -is [String] -or $SourceRange -is [OfficeOpenXml.ExcelAddress]) {
|
||||
$pivotTable = $wsPivot.PivotTables.Add($Address,$SourceWorkSheet.Cells[$SourceRange], $pivotTableName)
|
||||
elseif ( $SourceRange -is [String] -or $SourceRange -is [OfficeOpenXml.ExcelAddress]) {
|
||||
$pivotTable = $wsPivot.PivotTables.Add($Address, $SourceWorkSheet.Cells[$SourceRange], $pivotTableName)
|
||||
}
|
||||
else {Write-warning "Could not create a PivotTable with the Source Range provided."; return}
|
||||
foreach ($Row in $PivotRows) {
|
||||
@@ -192,13 +248,23 @@
|
||||
try { $null = $pivotTable.PageFields.Add($pivotTable.Fields[$pFilter])}
|
||||
catch {Write-Warning -message "Could not add '$pFilter' to Filter/Page fields in PivotTable $pivotTableName." }
|
||||
}
|
||||
if ($NoTotalsInPivot) {$PivotTotals = "None" }
|
||||
if ($PivotTotals -eq "None" -or $PivotTotals -eq "Columns") { $pivotTable.RowGrandTotals = $false }
|
||||
elseif ($PivotTotals -eq "Both" -or $PivotTotals -eq "Rows") { $pivotTable.RowGrandTotals = $true }
|
||||
if ($PivotTotals -eq "None" -or $PivotTotals -eq "Rows") { $pivotTable.ColumGrandTotals = $false } # Epplus spelling mistake, not mine!
|
||||
elseif ($PivotTotals -eq "Both" -or $PivotTotals -eq "Columns") { $pivotTable.ColumGrandTotals = $true }
|
||||
if ($PivotDataToColumn ) { $pivotTable.DataOnRows = $false }
|
||||
if ($PivotTableStyle) { $pivotTable.TableStyle = $PivotTableStyle}
|
||||
if ($PivotDataToColumn ) { $pivotTable.DataOnRows = $false }
|
||||
if ($PivotTableStyle) { $pivotTable.TableStyle = $PivotTableStyle}
|
||||
if ($GroupNumericRow) {
|
||||
$r = $pivotTable.RowFields.Where( {$_.name -eq $GroupNumericRow })
|
||||
if (-not $r ) {Write-Warning -Message "Could not find a Row field named '$GroupNumericRow'; no numeric grouping will be done."}
|
||||
else {$r.AddNumericGrouping($GroupNumericMin, $GroupNumericMax, $GroupNumericInterval)}
|
||||
}
|
||||
if ($GroupDateRow -and $PSBoundParameters.ContainsKey("GroupDatePart")) {
|
||||
$r = $pivotTable.RowFields.Where( {$_.name -eq $GroupDateRow })
|
||||
if (-not $r ) {Write-Warning -Message "Could not find a Row field named '$GroupDateRow'; no date grouping will be done."}
|
||||
else {$r.AddDateGrouping($GroupDatePart)}
|
||||
}
|
||||
}
|
||||
catch {Write-Warning -Message "Failed adding PivotTable '$pivotTableName': $_"}
|
||||
}
|
||||
@@ -211,16 +277,16 @@
|
||||
|
||||
#Create the chart if it doesn't exist, leave alone if it does.
|
||||
if ($IncludePivotChart -and -not $wsPivot.Drawings["Chart$pivotTableName"] ) {
|
||||
try {Add-ExcelChart -PivotTable $pivotTable -ChartType $ChartType -Width $ChartWidth -Height $ChartHeight -Row $ChartRow -Column $ChartColumn -RowOffSetPixels $ChartRowOffSetPixels -ColumnOffSetPixels $ChartColumnOffSetPixels -Title $ChartTitle -NoLegend:$NoLegend -ShowCategory:$ShowCategory -ShowPercent:$ShowPercent }
|
||||
catch {Write-Warning -Message "Failed adding chart for pivotable '$pivotTableName': $_"}
|
||||
}
|
||||
elseif ($PivotChartDefinition -and -not $wsPivot.Drawings["Chart$pivotTableName"]) {
|
||||
if ($PivotChartDefinition -is [System.Management.Automation.PSCustomObject]) {
|
||||
$params = @{PivotTable= $pivotTable }
|
||||
$params = @{PivotTable = $pivotTable }
|
||||
$PivotChartDefinition.PSObject.Properties | ForEach-Object {if ( $null -ne $_.value) {$params[$_.name] = $_.value}}
|
||||
Add-ExcelChart @params
|
||||
}
|
||||
elseif ($PivotChartDefinition -is [hashtable] -or $PivotChartDefinition -is[System.Collections.Specialized.OrderedDictionary]) {
|
||||
elseif ($PivotChartDefinition -is [hashtable] -or $PivotChartDefinition -is [System.Collections.Specialized.OrderedDictionary]) {
|
||||
Add-ExcelChart -PivotTable $pivotTable @PivotChartDefinition
|
||||
}
|
||||
}
|
||||
@@ -267,59 +333,71 @@ function New-PivotTableDefinition {
|
||||
[Switch]$PivotDataToColumn,
|
||||
#By default PivotTables have Totals for each Row (on the right) and for each column at the bottom. This allows just one or neither to be selected.
|
||||
#Define whther totals should be added to rows, columns neither, or both (the default is both)
|
||||
[ValidateSet("Both","Columns","Rows","None")]
|
||||
[ValidateSet("Both", "Columns", "Rows", "None")]
|
||||
[String]$PivotTotals = "Both",
|
||||
#Included for compatibility - equivalent to -PivotTotals "None"
|
||||
[Switch]$NoTotalsInPivot,
|
||||
#The name of a row field which should be grouped by parts of the date/time (ignored if GroupDateRow is not specified)
|
||||
[String]$GroupDateRow,
|
||||
#The Part(s) of the date to use in the grouping (ignored if GroupDateRow is not specified)
|
||||
[OfficeOpenXml.Table.PivotTable.eDateGroupBy[]]$GroupDatePart,
|
||||
#The name of a row field which should be grouped by Number (e.g 0-99, 100-199, 200-299 )
|
||||
[String]$GroupNumericRow,
|
||||
#The starting point for grouping
|
||||
[double]$GroupNumericMin = 0 ,
|
||||
#The endpoint for grouping
|
||||
[double]$GroupNumericMax = [Double]::MaxValue ,
|
||||
#The interval for grouping
|
||||
[double]$GroupNumericInterval = 100 ,
|
||||
#Number format to apply to the data cells in the PivotTable
|
||||
[string]$PivotNumberFormat,
|
||||
#Apply a table style to the PivotTable
|
||||
[OfficeOpenXml.Table.TableStyles]$PivotTableStyle,
|
||||
#Use a chart definition instead of specifying chart settings one by one
|
||||
[Parameter(ParameterSetName='ChartbyDef', Mandatory=$true, ValueFromPipelineByPropertyName=$true)]
|
||||
[Parameter(ParameterSetName = 'ChartbyDef', Mandatory = $true, ValueFromPipelineByPropertyName = $true)]
|
||||
$PivotChartDefinition,
|
||||
#If specified a chart Will be included.
|
||||
[Parameter(ParameterSetName='ChartbyParams')]
|
||||
[Parameter(ParameterSetName = 'ChartbyParams')]
|
||||
[Switch]$IncludePivotChart,
|
||||
#Optional title for the pivot chart, by default the title omitted.
|
||||
[Parameter(ParameterSetName='ChartbyParams')]
|
||||
[Parameter(ParameterSetName = 'ChartbyParams')]
|
||||
[String]$ChartTitle,
|
||||
#Height of the chart in Pixels (400 by default)
|
||||
[Parameter(ParameterSetName='ChartbyParams')]
|
||||
[Parameter(ParameterSetName = 'ChartbyParams')]
|
||||
[int]$ChartHeight = 400 ,
|
||||
#Width of the chart in Pixels (600 by default)
|
||||
[Parameter(ParameterSetName='ChartbyParams')]
|
||||
[Parameter(ParameterSetName = 'ChartbyParams')]
|
||||
[int]$ChartWidth = 600,
|
||||
#Cell position of the top left corner of the chart, there will be this number of rows above the top edge of the chart (default is 0, chart starts at top edge of row 1).
|
||||
[Parameter(ParameterSetName='ChartbyParams')]
|
||||
[Parameter(ParameterSetName = 'ChartbyParams')]
|
||||
[Int]$ChartRow = 0 ,
|
||||
#Cell position of the top left corner of the chart, there will be this number of cells to the left of the chart (default is 4, chart starts at left edge of column E)
|
||||
[Parameter(ParameterSetName='ChartbyParams')]
|
||||
[Parameter(ParameterSetName = 'ChartbyParams')]
|
||||
[Int]$ChartColumn = 4,
|
||||
#Vertical offset of the chart from the cell corner.
|
||||
[Parameter(ParameterSetName='ChartbyParams')]
|
||||
[Parameter(ParameterSetName = 'ChartbyParams')]
|
||||
[Int]$ChartRowOffSetPixels = 0 ,
|
||||
#Horizontal offset of the chart from the cell corner.
|
||||
[Parameter(ParameterSetName='ChartbyParams')]
|
||||
[Parameter(ParameterSetName = 'ChartbyParams')]
|
||||
[Int]$ChartColumnOffSetPixels = 0,
|
||||
#Type of chart
|
||||
[Parameter(ParameterSetName='ChartbyParams')]
|
||||
[Parameter(ParameterSetName = 'ChartbyParams')]
|
||||
[OfficeOpenXml.Drawing.Chart.eChartType]$ChartType = 'Pie',
|
||||
#If specified hides the chart legend
|
||||
[Parameter(ParameterSetName='ChartbyParams')]
|
||||
[Parameter(ParameterSetName = 'ChartbyParams')]
|
||||
[Switch]$NoLegend,
|
||||
#if specified attaches the category to slices in a pie chart : not supported on all chart types, this may give errors if applied to an unsupported type.
|
||||
[Parameter(ParameterSetName='ChartbyParams')]
|
||||
[Parameter(ParameterSetName = 'ChartbyParams')]
|
||||
[Switch]$ShowCategory,
|
||||
#If specified attaches percentages to slices in a pie chart.
|
||||
[Parameter(ParameterSetName='ChartbyParams')]
|
||||
[Parameter(ParameterSetName = 'ChartbyParams')]
|
||||
[Switch]$ShowPercent,
|
||||
#If there is already content in the workbook the sheet with the PivotTable will not be active UNLESS Activate is specified
|
||||
[switch]$Activate
|
||||
)
|
||||
$validDataFuntions = [system.enum]::GetNames([OfficeOpenXml.Table.PivotTable.DataFieldFunctions])
|
||||
|
||||
if ($PivotData.values.Where({$_ -notin $validDataFuntions}) ) {
|
||||
if ($PivotData.values.Where( {$_ -notin $validDataFuntions}) ) {
|
||||
Write-Warning -Message ("Pivot data functions might not be valid, they should be one of " + ($validDataFuntions -join ", ") + ".")
|
||||
}
|
||||
|
||||
@@ -330,8 +408,8 @@ function New-PivotTableDefinition {
|
||||
}
|
||||
$parameters.Remove('PivotTableName')
|
||||
if ($PivotChartDefinition) {
|
||||
$parameters.PivotChartDefinition.XRange = $null
|
||||
$parameters.PivotChartDefinition.YRange = $null
|
||||
$parameters.PivotChartDefinition.XRange = $null
|
||||
$parameters.PivotChartDefinition.YRange = $null
|
||||
$parameters.PivotChartDefinition.SeriesHeader = $null
|
||||
}
|
||||
@{$PivotTableName = $parameters}
|
||||
|
||||
16
README.md
16
README.md
@@ -53,7 +53,21 @@ Install-Module ImportExcel -scope CurrentUser
|
||||
Install-Module ImportExcel
|
||||
```
|
||||
|
||||
# What's new 5.4
|
||||
# What's new 5.4.3
|
||||
|
||||
- Added Remove-Worksheet: Removes one or more worksheets from one or more workbooks
|
||||
|
||||
|
||||
# What's new 5.4.2
|
||||
|
||||
- Added parameters -GroupDateRow and -GroupDatePart & -GroupNumericRow, -GroupNumericMin, -GroupNumericMax and -GroupNumericInterval
|
||||
to Add-PivotTable and New-PivotTableDefinition. The date ones gather dates of the same year and/or quarter and/or month and/or day etc.
|
||||
the number ones group numbers into bands, starting at Min, and going up steps specified by Interval. Added tests and help for these.
|
||||
- Set-ExcelRow and Set-ExcelColumn now check that the worksheet name they passed exists in the workbook.
|
||||
|
||||
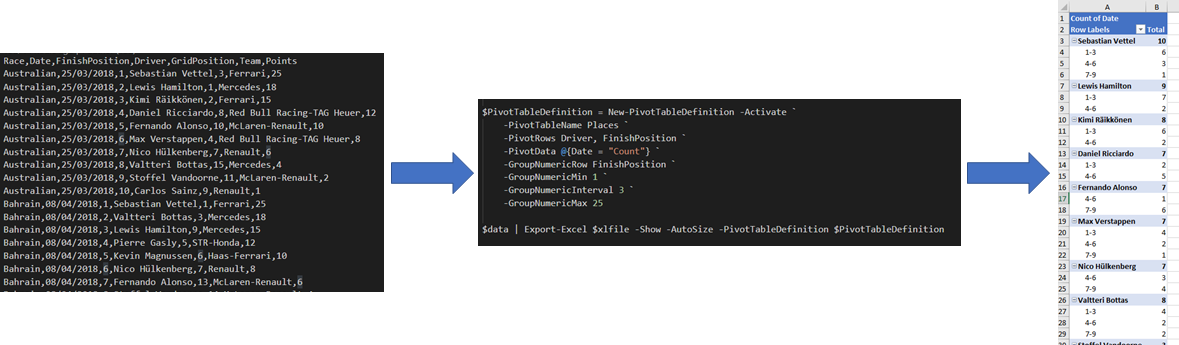
|
||||
|
||||
# What's new 5.4.0
|
||||
|
||||
- Thank you to Conrad Agramont, Twitter: [@AGramont](https://twitter.com/@AGramont) for the `AddMultiWorkSheet.ps1` example. Much appreciated!
|
||||
- Fixed several more bugs where parameters were ignored if passed a zero value
|
||||
|
||||
@@ -1,34 +1,43 @@
|
||||
Function Remove-WorkSheet {
|
||||
Param (
|
||||
$Path,
|
||||
$WorksheetName
|
||||
<#
|
||||
.SYNOPSIS
|
||||
Removes one or more worksheets from one or more workbooks
|
||||
.EXAMPLE
|
||||
C:\> Remove-WorkSheet -Path Test1.xlsx -WorksheetName Sheet1
|
||||
Removes the worksheet named 'Sheet1' from 'Test1.xlsx'
|
||||
|
||||
C:\> Remove-WorkSheet -Path Test1.xlsx -WorksheetName Sheet1,Target1
|
||||
Removes the worksheet named 'Sheet1' and 'Target1' from 'Test1.xlsx'
|
||||
|
||||
C:\> Remove-WorkSheet -Path Test1.xlsx -WorksheetName Sheet1,Target1 -Show
|
||||
Removes the worksheets and then launches the xlsx in Excel
|
||||
|
||||
C:\> dir c:\reports\*.xlsx | Remove-WorkSheet
|
||||
Removes 'Sheet1' from all the xlsx files in the c:\reports directory
|
||||
|
||||
#>
|
||||
param(
|
||||
# [Parameter(ValueFromPipelineByPropertyName)]
|
||||
[Parameter(ValueFromPipelineByPropertyName)]
|
||||
[Alias('Path')]
|
||||
$FullName,
|
||||
[String[]]$WorksheetName = "Sheet1",
|
||||
[Switch]$Show
|
||||
)
|
||||
|
||||
$Path = (Resolve-Path $Path).ProviderPath
|
||||
|
||||
$Excel = New-Object -TypeName OfficeOpenXml.ExcelPackage $Path
|
||||
|
||||
$workSheet = $Excel.Workbook.Worksheets[$WorkSheetName]
|
||||
|
||||
if($workSheet) {
|
||||
if($Excel.Workbook.Worksheets.Count -gt 1) {
|
||||
$Excel.Workbook.Worksheets.Delete($workSheet)
|
||||
} else {
|
||||
throw "Cannot delete $WorksheetName. A workbook must contain at least one visible worksheet"
|
||||
Process {
|
||||
if (!$FullName) {
|
||||
throw "Remove-WorkSheet requires the and Excel file"
|
||||
}
|
||||
|
||||
} else {
|
||||
throw "$WorksheetName not found"
|
||||
$pkg = Open-ExcelPackage -Path $FullName
|
||||
|
||||
if ($pkg) {
|
||||
foreach ($wsn in $WorksheetName) {
|
||||
$pkg.Workbook.Worksheets.Delete($wsn)
|
||||
}
|
||||
|
||||
Close-ExcelPackage -ExcelPackage $pkg -Show:$Show
|
||||
}
|
||||
}
|
||||
|
||||
$Excel.Save()
|
||||
$Excel.Dispose()
|
||||
}
|
||||
|
||||
|
||||
Import-Module .\ImportExcel.psd1 -Force
|
||||
|
||||
$names = Get-ExcelSheetInfo C:\Temp\testDelete.xlsx
|
||||
$names | Foreach-Object { Remove-WorkSheet C:\Temp\testDelete.xlsx $_.Name}
|
||||
|
||||
##Remove-WorkSheet C:\Temp\testDelete.xlsx sheet6
|
||||
}
|
||||
@@ -121,7 +121,12 @@
|
||||
|
||||
begin {
|
||||
#if we were passed a package object and a worksheet name , get the worksheet.
|
||||
if ($ExcelPackage) {$Worksheet = $ExcelPackage.Workbook.Worksheets[$Worksheetname] }
|
||||
if ($ExcelPackage) {
|
||||
if ($ExcelPackage.Workbook.Worksheets.Name -notcontains $Worksheetname) {
|
||||
throw "The Workbook does not contain a sheet named '$Worksheetname'"
|
||||
}
|
||||
else {$Worksheet = $ExcelPackage.Workbook.Worksheets[$Worksheetname] }
|
||||
}
|
||||
|
||||
#In a script block to build a formula, we may want any of corners or the column name,
|
||||
#if Column and Startrow aren't specified, assume first unused column, and first row
|
||||
@@ -151,10 +156,11 @@
|
||||
if ($PSBoundParameters.ContainsKey('Value')) { foreach ($row in ($StartRow..$endRow)) {
|
||||
if ($Value -is [scriptblock]) { #re-create the script block otherwise variables from this function are out of scope.
|
||||
$cellData = & ([scriptblock]::create( $Value ))
|
||||
Write-Verbose -Message $cellData
|
||||
if ($null -eq $cellData) {Write-Verbose -Message "Script block evaluates to null."}
|
||||
else {Write-Verbose -Message "Script block evaluates to '$cellData'"}
|
||||
}
|
||||
else { $cellData = $Value}
|
||||
if ($cellData -match "^=") { $Worksheet.Cells[$Row, $Column].Formula = ($cellData -replace '^=','') } #EPPlus likes formulas with no = sign; Excel doesn't care
|
||||
if ($cellData -match "^=") { $Worksheet.Cells[$Row, $Column].Formula = ($cellData -replace '^=','') } #EPPlus likes formulas with no = sign; Excel doesn't care
|
||||
elseif ( [System.Uri]::IsWellFormedUriString($cellData , [System.UriKind]::Absolute)) {
|
||||
# Save a hyperlink : internal links can be in the form xl://sheet!E419 (use A1 as goto sheet), or xl://RangeName
|
||||
if ($cellData -match "^xl://internal/") {
|
||||
@@ -163,13 +169,13 @@
|
||||
$h = New-Object -TypeName OfficeOpenXml.ExcelHyperLink -ArgumentList $referenceAddress , $display
|
||||
$Worksheet.Cells[$Row, $Column].HyperLink = $h
|
||||
}
|
||||
else {$Worksheet.Cells[$Row, $Column].HyperLink = $cellData }
|
||||
$Worksheet.Cells[$Row, $Column].Style.Font.Color.SetColor([System.Drawing.Color]::Blue)
|
||||
else {$Worksheet.Cells[$Row, $Column].HyperLink = $cellData }
|
||||
$Worksheet.Cells[$Row, $Column].Style.Font.UnderLine = $true
|
||||
$Worksheet.Cells[$Row, $Column].Style.Font.Color.SetColor([System.Drawing.Color]::Blue)
|
||||
}
|
||||
else { $Worksheet.Cells[$Row, $Column].Value = $cellData }
|
||||
if ($cellData -is [datetime]) { $Worksheet.Cells[$Row, $Column].Style.Numberformat.Format = 'm/d/yy h:mm' } # This is not a custom format, but a preset recognized as date and localized.
|
||||
if ($cellData -is [timespan]) { $Worksheet.Cells[$Row, $Column].Style.Numberformat.Format = '[h]:mm:ss' }
|
||||
}}
|
||||
|
||||
#region Apply formatting
|
||||
|
||||
11
Set-Row.ps1
11
Set-Row.ps1
@@ -116,8 +116,12 @@
|
||||
)
|
||||
begin {
|
||||
#if we were passed a package object and a worksheet name , get the worksheet.
|
||||
if ($ExcelPackage) {$Worksheet = $ExcelPackage.Workbook.worksheets[$Worksheetname] }
|
||||
|
||||
if ($ExcelPackage) {
|
||||
if ($ExcelPackage.Workbook.Worksheets.Name -notcontains $Worksheetname) {
|
||||
throw "The Workbook does not contain a sheet named '$Worksheetname'"
|
||||
}
|
||||
else {$Worksheet = $ExcelPackage.Workbook.Worksheets[$Worksheetname] }
|
||||
}
|
||||
#In a script block to build a formula, we may want any of corners or the columnname,
|
||||
#if row and start column aren't specified assume first unused row, and first column
|
||||
if (-not $StartColumn) {$StartColumn = $Worksheet.Dimension.Start.Column }
|
||||
@@ -143,7 +147,8 @@
|
||||
if ($Value -is [scriptblock] ) {
|
||||
#re-create the script block otherwise variables from this function are out of scope.
|
||||
$cellData = & ([scriptblock]::create( $Value ))
|
||||
Write-Verbose -Message $cellData
|
||||
if ($null -eq $cellData) {Write-Verbose -Message "Script block evaluates to null."}
|
||||
else {Write-Verbose -Message "Script block evaluates to '$cellData'"}
|
||||
}
|
||||
else{$cellData = $Value}
|
||||
if ($cellData -match "^=") { $Worksheet.Cells[$Row, $column].Formula = ($cellData -replace '^=','') } #EPPlus likes formulas with no = sign; Excel doesn't care
|
||||
|
||||
@@ -1,46 +1,56 @@
|
||||
$scriptPath = Split-Path -Path $MyInvocation.MyCommand.path -Parent
|
||||
$dataPath = Join-Path -Path $scriptPath -ChildPath "First10Races.csv"
|
||||
$scriptPath = Split-Path -Path $MyInvocation.MyCommand.path -Parent
|
||||
$dataPath = Join-Path -Path $scriptPath -ChildPath "First10Races.csv"
|
||||
|
||||
Describe "Creating small named ranges with hyperlinks" {
|
||||
BeforeAll {
|
||||
$path = "$env:TEMP\Results.xlsx"
|
||||
$path = "$env:TEMP\Results.xlsx"
|
||||
Remove-Item -Path $path -ErrorAction SilentlyContinue
|
||||
#Read race results, and group by race name : export 1 row to get headers, leaving enough rows aboce to put in a link for each race
|
||||
$results = Import-Csv -Path $dataPath | Group-Object -Property RACE
|
||||
$topRow = $lastDataRow = 1 + $results.Count
|
||||
$excel = $results[0].Group[0] | Export-Excel -Path $path -StartRow $TopRow -BoldTopRow -PassThru
|
||||
$results = Import-Csv -Path $dataPath |
|
||||
Select-Object Race, @{n = "Date"; e = {[datetime]::ParseExact($_.date, "dd/MM/yyyy", (Get-Culture))}}, FinishPosition, Driver, GridPosition, Team, Points |
|
||||
Group-Object -Property RACE
|
||||
$topRow = $lastDataRow = 1 + $results.Count
|
||||
$excel = $results[0].Group[0] | Export-Excel -Path $path -StartRow $TopRow -BoldTopRow -PassThru
|
||||
|
||||
#export each group (race) below the last one, without headers, and create a range for each using the group name (Race)
|
||||
foreach ($r in $results) {
|
||||
$excel = $R.Group | Export-Excel -ExcelPackage $excel -NoHeader -StartRow ($lastDataRow +1) -RangeName $R.Name -PassThru -AutoSize
|
||||
$excel = $R.Group | Export-Excel -ExcelPackage $excel -NoHeader -StartRow ($lastDataRow + 1) -RangeName $R.Name -PassThru -AutoSize
|
||||
$lastDataRow += $R.Group.Count
|
||||
}
|
||||
$worksheet = $excel.Workbook.Worksheets[1]
|
||||
$columns = $worksheet.Dimension.Columns
|
||||
$columns = $worksheet.Dimension.Columns
|
||||
|
||||
1..$columns | ForEach-Object {Add-ExcelName -Range $worksheet.cells[$topRow,$_,$lastDataRow,$_]} #Test Add-Excel Name on its own (outside Export-Excel)
|
||||
1..$columns | ForEach-Object {Add-ExcelName -Range $worksheet.cells[$topRow, $_, $lastDataRow, $_]} #Test Add-Excel Name on its own (outside Export-Excel)
|
||||
|
||||
$scwarnVar = $null
|
||||
Set-ExcelColumn -Worksheet $worksheet -StartRow $topRow -Heading "PlacesGained/Lost" `
|
||||
-Value "=GridPosition-FinishPosition" -AutoNameRange -WarningVariable scWarnVar -WarningAction SilentlyContinue #Test as many set column options as possible.
|
||||
-Value "=GridPosition-FinishPosition" -AutoNameRange -WarningVariable scWarnVar -WarningAction SilentlyContinue #Test as many set column options as possible.
|
||||
$columns ++
|
||||
|
||||
#create a table which covers all the data. And define a pivot table which uses the same address range.
|
||||
$table = Add-ExcelTable -PassThru -Range $worksheet.cells[$topRow,1,$lastDataRow,$columns] -TableName "AllResults" -TableStyle Light4 `
|
||||
-ShowHeader -ShowFilter -ShowColumnStripes -ShowRowStripes:$false -ShowFirstColumn:$false -ShowLastColumn:$false -ShowTotal:$false #Test Add-ExcelTable outside export-Excel with as many options as possible.
|
||||
$pt = New-PivotTableDefinition -PivotTableName Analysis -SourceWorkSheet $worksheet -SourceRange $table.address.address -PivotRows Driver -PivotData @{Points="SUM"} -PivotTotals None
|
||||
$table = Add-ExcelTable -PassThru -Range $worksheet.cells[$topRow, 1, $lastDataRow, $columns] -TableName "AllResults" -TableStyle Light4 `
|
||||
-ShowHeader -ShowFilter -ShowColumnStripes -ShowRowStripes:$false -ShowFirstColumn:$false -ShowLastColumn:$false -ShowTotal:$false #Test Add-ExcelTable outside export-Excel with as many options as possible.
|
||||
$pt = New-PivotTableDefinition -PivotTableName Analysis -SourceWorkSheet $worksheet -SourceRange $table.address.address -PivotRows Driver -PivotData @{Points = "SUM"} -PivotTotals None
|
||||
|
||||
$cf = Add-ConditionalFormatting -Address $worksheet.cells[$topRow,$columns,$lastDataRow,$columns] -ThreeIconsSet Arrows -Passthru #Test using cells[r1,c1,r2,c2]
|
||||
$cf = Add-ConditionalFormatting -Address $worksheet.cells[$topRow, $columns, $lastDataRow, $columns] -ThreeIconsSet Arrows -Passthru #Test using cells[r1,c1,r2,c2]
|
||||
$cf.Icon2.Type = $cf.Icon3.Type = "Num"
|
||||
$cf.Icon2.Value = 0
|
||||
$cf.Icon3.Value = 1
|
||||
Add-ConditionalFormatting -Address $worksheet.cells["FinishPosition"] -RuleType Equal -ConditionValue 1 -ForeGroundColor ([System.Drawing.Color]::Purple) -Bold -Priority 1 -StopIfTrue #Test Priority and stopIfTrue and using range name
|
||||
Add-ConditionalFormatting -Address $worksheet.Cells["GridPosition"] -RuleType ThreeColorScale -Reverse #Test Reverse
|
||||
$ct = New-ConditionalText -Text "Ferrari"
|
||||
$ct2 = New-ConditionalText -Range $worksheet.Names["FinishPosition"].Address -ConditionalType LessThanOrEqual -Text 3 -ConditionalText ([System.Drawing.Color]::Red) -Background ([System.Drawing.Color]::White) #Test new-conditionalText in shortest and longest forms.
|
||||
$ct2 = New-ConditionalText -Range $worksheet.Names["FinishPosition"].Address -ConditionalType LessThanOrEqual -Text 3 -ConditionalText ([System.Drawing.Color]::Red) -Background ([System.Drawing.Color]::White) #Test new-conditionalText in shortest and longest forms.
|
||||
#Create links for each group name (race) and Export them so they start at Cell A1; create a pivot table with definition just created, save the file and open in Excel
|
||||
$results | ForEach-Object {(New-Object -TypeName OfficeOpenXml.ExcelHyperLink -ArgumentList "Sheet1!$($_.Name)" , "$($_.name) GP")} | #Test Exporting Hyperlinks with display property.
|
||||
Export-Excel -ExcelPackage $excel -AutoSize -PivotTableDefinition $pt -Calculate -ConditionalFormat $ct,$ct2 #Test conditional text rules in conditional format (orignally icon sets only )
|
||||
$excel = $results | ForEach-Object {(New-Object -TypeName OfficeOpenXml.ExcelHyperLink -ArgumentList "Sheet1!$($_.Name)" , "$($_.name) GP")} | #Test Exporting Hyperlinks with display property.
|
||||
Export-Excel -ExcelPackage $excel -AutoSize -PivotTableDefinition $pt -Calculate -ConditionalFormat $ct, $ct2 -PassThru #Test conditional text rules in conditional format (orignally icon sets only )
|
||||
|
||||
$null = Add-WorkSheet -ExcelPackage $excel -WorksheetName "Points1"
|
||||
Add-PivotTable -PivotTableName "Points1" -Address $excel.Points1.Cells["A1"] -ExcelPackage $excel -SourceWorkSheet sheet1 -SourceRange $excel.Sheet1.Tables[0].Address.Address -PivotRows Driver, Date -PivotData @{Points = "SUM"} -GroupDateRow Date -GroupDatePart Years, Months
|
||||
|
||||
$null = Add-WorkSheet -ExcelPackage $excel -WorksheetName "Places1"
|
||||
$newpt = Add-PivotTable -PivotTableName "Places1" -Address $excel.Places1.Cells["A1"] -ExcelPackage $excel -SourceWorkSheet sheet1 -SourceRange $excel.Sheet1.Tables[0].Address.Address -PivotRows Driver, FinishPosition -PivotData @{Date = "Count"} -GroupNumericRow FinishPosition -GroupNumericMin 1 -GroupNumericMax 25 -GroupNumericInterval 3 -PassThru
|
||||
$newpt.RowFields[0].SubTotalFunctions = [OfficeOpenXml.Table.PivotTable.eSubTotalFunctions]::None
|
||||
Close-ExcelPackage -ExcelPackage $excel
|
||||
|
||||
$excel = Open-ExcelPackage $path
|
||||
$sheet = $excel.Workbook.Worksheets[1]
|
||||
@@ -62,14 +72,14 @@ Describe "Creating small named ranges with hyperlinks" {
|
||||
}
|
||||
Context "Adding calculated column" {
|
||||
It "Populated the cells with the right heading and formulas " {
|
||||
$sheet.Cells[( $results.Count),$columns] | Should benullorEmpty
|
||||
$sheet.Cells[(1+$results.Count),$columns].Value | Should be "PlacesGained/Lost"
|
||||
$sheet.Cells[(2+$results.Count),$columns].Formula | should be "GridPosition-FinishPosition"
|
||||
$sheet.Cells[( $results.Count), $columns] | Should benullorEmpty
|
||||
$sheet.Cells[(1 + $results.Count), $columns].Value | Should be "PlacesGained/Lost"
|
||||
$sheet.Cells[(2 + $results.Count), $columns].Formula | should be "GridPosition-FinishPosition"
|
||||
$sheet.Names["PlacesGained_Lost"] | should not benullorEmpty
|
||||
}
|
||||
It "Performed the calculation " {
|
||||
$placesMade = $Sheet.Cells[(2+$results.Count),5].value - $Sheet.Cells[(2+$results.Count),3].value
|
||||
$sheet.Cells[(2+$results.Count),$columns].value | Should be $placesmade
|
||||
$placesMade = $Sheet.Cells[(2 + $results.Count), 5].value - $Sheet.Cells[(2 + $results.Count), 3].value
|
||||
$sheet.Cells[(2 + $results.Count), $columns].value | Should be $placesmade
|
||||
}
|
||||
It "Applied ConditionalFormatting, including StopIfTrue, Priority and Reverse " {
|
||||
$sheet.ConditionalFormatting[0].Address.Start.Column | should be $columns
|
||||
@@ -98,4 +108,32 @@ Describe "Creating small named ranges with hyperlinks" {
|
||||
$sheet.Tables[0].ShowRowStripes | should not be $true
|
||||
}
|
||||
}
|
||||
Context "Adding Pivot tables" {
|
||||
it "Added a worksheet with a pivot table grouped by date " {
|
||||
$excel.Points1 | should not beNullOrEmpty
|
||||
$excel.Points1.PivotTables.Count | should be 1
|
||||
$pt = $excel.Points1.PivotTables[0]
|
||||
$pt.RowFields.Count | should be 3
|
||||
$pt.RowFields[0].name | should be "Driver"
|
||||
$pt.RowFields[0].Grouping | should benullorEmpty
|
||||
$pt.RowFields[1].name | should be "years"
|
||||
$pt.RowFields[1].Grouping | should not benullorEmpty
|
||||
$pt.RowFields[2].name | should be "date"
|
||||
$pt.RowFields[2].Grouping | should not benullorEmpty
|
||||
}
|
||||
it "Added a worksheet with a pivot table grouped by Number " {
|
||||
$excel.Places1 | should not beNullOrEmpty
|
||||
$excel.Places1.PivotTables.Count | should be 1
|
||||
$pt = $excel.Places1.PivotTables[0]
|
||||
$pt.RowFields.Count | should be 2
|
||||
$pt.RowFields[0].name | should be "Driver"
|
||||
$pt.RowFields[0].Grouping | should benullorEmpty
|
||||
$pt.RowFields[0].SubTotalFunctions.ToString() | should be "None"
|
||||
$pt.RowFields[1].name | should be "FinishPosition"
|
||||
$pt.RowFields[1].Grouping | should not benullorEmpty
|
||||
$pt.RowFields[1].Grouping.Start | should be 1
|
||||
$pt.RowFields[1].Grouping.End | should be 25
|
||||
$pt.RowFields[1].Grouping.Interval | should be 3
|
||||
}
|
||||
}
|
||||
}
|
||||
78
__tests__/Remove-WorkSheet.tests.ps1
Normal file
78
__tests__/Remove-WorkSheet.tests.ps1
Normal file
@@ -0,0 +1,78 @@
|
||||
#Requires -Modules Pester
|
||||
Import-Module $PSScriptRoot\..\ImportExcel.psd1 -Force
|
||||
|
||||
Describe "Remove Worksheet" {
|
||||
Context "Remove a worksheet output" {
|
||||
BeforeEach {
|
||||
# Create three sheets
|
||||
$data = ConvertFrom-Csv @"
|
||||
Name,Age
|
||||
Jane,10
|
||||
John,20
|
||||
"@
|
||||
$xlFile1 = "$env:TEMP\RemoveWorsheet1.xlsx"
|
||||
Remove-Item $xlFile1 -ErrorAction SilentlyContinue
|
||||
|
||||
$data | Export-Excel -Path $xlFile1 -WorksheetName Target1
|
||||
$data | Export-Excel -Path $xlFile1 -WorksheetName Target2
|
||||
$data | Export-Excel -Path $xlFile1 -WorksheetName Target3
|
||||
$data | Export-Excel -Path $xlFile1 -WorksheetName Sheet1
|
||||
|
||||
$xlFile2 = "$env:TEMP\RemoveWorsheet2.xlsx"
|
||||
Remove-Item $xlFile2 -ErrorAction SilentlyContinue
|
||||
|
||||
$data | Export-Excel -Path $xlFile2 -WorksheetName Target1
|
||||
$data | Export-Excel -Path $xlFile2 -WorksheetName Target2
|
||||
$data | Export-Excel -Path $xlFile2 -WorksheetName Target3
|
||||
$data | Export-Excel -Path $xlFile2 -WorksheetName Sheet1
|
||||
}
|
||||
|
||||
it "Should throw about the Path" {
|
||||
{Remove-WorkSheet} | Should throw 'Remove-WorkSheet requires the and Excel file'
|
||||
}
|
||||
|
||||
it "Should delete Target2" {
|
||||
Remove-WorkSheet -Path $xlFile1 -WorksheetName Target2
|
||||
|
||||
$actual = Get-ExcelSheetInfo -Path $xlFile1
|
||||
|
||||
$actual.Count | Should Be 3
|
||||
$actual[0].Name | Should Be "Target1"
|
||||
$actual[1].Name | Should Be "Target3"
|
||||
$actual[2].Name | Should Be "Sheet1"
|
||||
}
|
||||
|
||||
it "Should delete Sheet1" {
|
||||
Remove-WorkSheet -Path $xlFile1
|
||||
|
||||
$actual = Get-ExcelSheetInfo -Path $xlFile1
|
||||
|
||||
$actual.Count | Should Be 3
|
||||
$actual[0].Name | Should Be "Target1"
|
||||
$actual[1].Name | Should Be "Target2"
|
||||
$actual[2].Name | Should Be "Target3"
|
||||
}
|
||||
|
||||
it "Should delete multiple sheets" {
|
||||
Remove-WorkSheet -Path $xlFile1 -WorksheetName Target1, Sheet1
|
||||
|
||||
$actual = Get-ExcelSheetInfo -Path $xlFile1
|
||||
|
||||
$actual.Count | Should Be 2
|
||||
$actual[0].Name | Should Be "Target2"
|
||||
$actual[1].Name | Should Be "Target3"
|
||||
}
|
||||
|
||||
it "Should delete sheet from multiple workbooks" {
|
||||
|
||||
Get-ChildItem "$env:TEMP\RemoveWorsheet*.xlsx" | Remove-WorkSheet
|
||||
|
||||
$actual = Get-ExcelSheetInfo -Path $xlFile1
|
||||
|
||||
$actual.Count | Should Be 3
|
||||
$actual[0].Name | Should Be "Target1"
|
||||
$actual[1].Name | Should Be "Target2"
|
||||
$actual[2].Name | Should Be "Target3"
|
||||
}
|
||||
}
|
||||
}
|
||||
BIN
images/GroupingNumeric.png
Normal file
BIN
images/GroupingNumeric.png
Normal file
Binary file not shown.
|
After Width: | Height: | Size: 200 KiB |
BIN
images/exportstockinfo.gif
Normal file
BIN
images/exportstockinfo.gif
Normal file
Binary file not shown.
|
After Width: | Height: | Size: 3.2 MiB |
Reference in New Issue
Block a user